30-Year US T-Bonds Price Forecast
 share
share
 share
share
 share
share
 share
share
 share
share
There has been quite a bit of chatter recently about interest rates in the US with many proclaiming interest rates are now headed up. Are these voices right? Having just analysed the technicals of the 30 Year US Treasury Bonds, it is my considered opinion that they are both right and wrong.
Keeping in mind that interest rates go up as bond prices go down, let’s investigate the price charts and we’ll mix it up by starting with the monthly chart first.
30YR US T-BONDS MONTHLY CHART
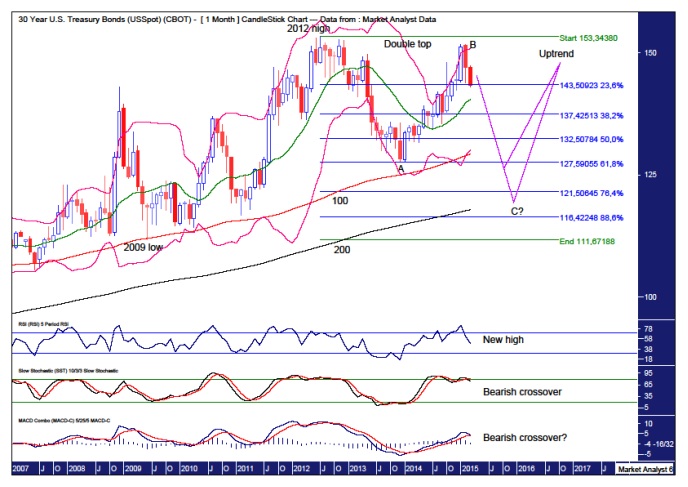
We can see price put in a high in 2012 at 153.34. Since then price has corrected and then rallied all the way back up only to fall just shy of all time record highs.
This has set up a double top. However, this double top is against the trend so it is not very bearish. Sure, it is great for traders that play the expected reaction downwards but as double tops generally don’t end bull trends, once the move down has run its course price should then come back up and bust to new highs.
To my eye, it looks like an ABC corrective pattern is in play with the wave A low and wave B high already in place. That means price has just commenced the move down that will eventually put in a wave C low.
The Bollinger Bands show price just starting to move away from the upper band so this move is still in its infancy.
So where is the wave C low likely to be?
I have added Fibonacci retracement levels of the move up from 2009 low to 2012 high. The wave A low was a smidgeon above the 61.8% level which stands at 127.59 and my favoured scenario is price making a false break low of the wave A low which would be a smidgeon under the 61.8% level. This would set up a double bottom which would be very bullish as it would be with the trend.
My second favoured scenario for low is price making a deeper retracement back to the 76.4% level at 121.50 and probably a tad lower.
The Relative Strength Indicator (RSI) is showing a new high reading on the recent wave B price high. This is a bullish sign. I like final highs to be accompanied by bearish divergences which would require price to eventually trade higher while the RSI reading makes less high readings. For now, the RSI looks to be trending down and I expect it to bottom out near the oversold line.
The Stochastic indicator has just made a bearish crossover while the Moving Average Convergence Divergence (MACD) indicator looks to be threatening one.
So, the lower indicators appear to be signalling lower prices are likely in the months ahead.
However, let’s not delude ourselves about the fact that a strong bull trend is still in play which is evidenced by the moving averages I have added to the chart. The 100 period moving average (red) is still well above the 200 period moving average (black) and they both appear to be trending up uniformly.
Let’s now looks at the big picture yearly chart.
30YR US T-BONDS YEARLY CHART
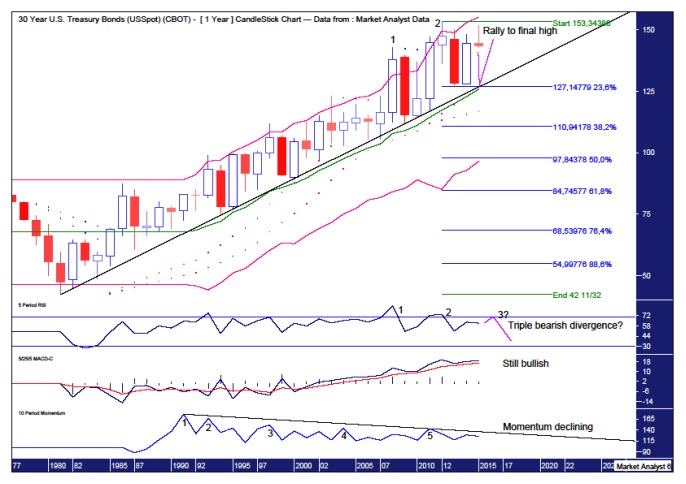
We can see the massive uptrend that has been in progress since the 1981 low at 42.11. The black uptrend line I have drawn has never been threatened seriously in all that time. Outstanding!
There looks to be a “three strikes and you’re out” top formation in play which consists of three consecutive higher highs. We already have the first two highs in place, denoted by the numbers 1 and 2, and now just await the third and likely final high.
The RSI is showing a bearish divergence at the 2012 high and I’d really like to see a triple bearish divergence set up on the expected third and final high. Let’s see.
The MACD indicator is still trending up bullishly with the blue line above the red line. No sign of damage there yet.
The Momentum indicator shows momentum is indeed declining and there are already five bearish divergences in place. My tip is the final high will be accompanied by a sixth bearish divergence. Time will tell.
As for where to expect the coming correction low, I am looking for the black uptrend line to once again provide support.
I have added Bollinger Bands and I think the middle band can be relied on for support once again.
I have also added Fibonacci retracement levels of the whole move up from 1981 low to 2012 high and, considering the bull market is in its final stages and corrections should not be deep, I favour the next major low to be around the 23.6% level which stands at 127.14.
Finally, I have added the Parabolic Stop and Reverse (PSAR) indicator which pertains to the dots on the chart. Now I have added two sets of dots – a tight setting and a loose setting.
The tight setting PSAR support is at 126.13 for this year and I would like to see the correction low being just above that level. This is my favoured scenario while my second favoured scenario would see price pull up just above the loose setting PSAR support which stands at 116.92.
Let’s now finish up the analysis by bringing it in tight with the daily chart.
30YR US T-BONDS DAILY CHART
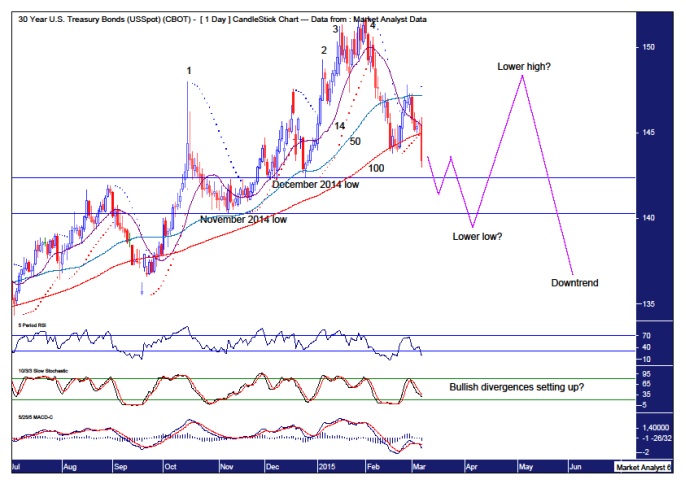
We can see the recent high was a fourth strike high which is denoted by the numbers 1 through to 4. This was accompanied by multiple bearish divergences in the lower indicators being the RSI, Stochastic and MACD indicators. So we have a solid intermediate top in place. Price is now headed down and it looks like some bullish divergences may set up on these lower indicators which would likely give rise to a bear rally.
The PSAR indicator has a bearish bias with the dots above price.
I have drawn two horizontal lines which denote the previous swing lows set in December 2014 at 142.34 and November 2014 at 140.25. I would like to see price take out both of these levels before a serious bear rally commences.
I have added moving averages with time periods of 14 (purple), 50 (blue) and 100 (red). The 14ma has already made a bearish crossover of the 50ma and looks set to do the same with the 100ma. I suspect the bear rally won’t start until the 50ma looks set to make a bearish crossover with the 100ma. Time will tell.
Once that lower low is in place, price can rally and eventually put in a lower high. From there a big move down should ensue as price makes its way to the expected low levels already outlined.
Summing up, bond prices look set to decline in 2015 before resuming the bull trend which should see the bond price make all time record highs in future.
And once that high is in place, the bull trend that began in 1981 will have likely run its course and a massive bear trend should commence. This should see bond prices collapse which will send shockwaves throughout the world and may well see a change in the world order.
********
My website is www.thevoodooanalyst.com
© 2014 Copyright The Voodoo Analyst - All Rights Reserved
Disclaimer: The above is a matter of opinion provided for general information purposes only and is not intended as investment advice. Information and analysis above are derived from sources and utilising methods believed to be reliable, but we cannot accept responsibility for any losses you may incur as a result of this analysis. Individuals should consult with their personal financial advisors. Put simply, it is JUST MY OPINION.
share
share
share
share
share
More from Silver Phoenix 500


