Analyzing Silver’s History
 share
share
 share
share
 share
share
 share
share
 share
share
 Speculating successfully on the price of Silver is generally not easy to achieve compared to other commodities and currencies. Movement in the price of Silver over the years has been marked by sudden explosive directional moves, the occasional good trend, and long periods of consolidation. This is not an instrument to be treated lightly and a historical study of movement in the price of Silver should be undertaken and considered before constructing any speculative strategies.
Silver’s Price History
During the 1970’s, Silver behaved quite typically as part of the amazing explosion in the prices of commodities such as precious metals. The price nearly tripled during the first half of that decade before consolidating before experiencing an incredibly dramatic rise from 1978 to 1980, during which period the price rose by almost 875%! Within a few short months the price fell back by more than 70%, then bounced upwards by more than 100% before consolidating in a downwards triangle during the first few years of the 1980’s. It eventually fell back to its mid-1970’s price range which perhaps could be referred to as the “natural” price of Silver.
A long-term consolidation followed from 1990 to 2004 when the price was contained largely within a range from $3.4 to $6.5. The next few years were spent building a higher bullish base before a sharp upwards move coinciding with the late 2000’s commodity boom. From 2005 to 2008 there was a dramatic price increase of approximately 250%, followed by an almost equally deep sharp pullback. Then came an upwards explosion lasting from 2008 to 2011 that was even more dramatic than the boom of the late 1970’s, which saw the price reaching a greater high of just under $50, an increase of approximately 600% in under two and a half years. This was very similar technically to the late 1970’s boom. Since 2011 there has been a strong falling-off that is reminiscent of the pattern in the early 1980’s.
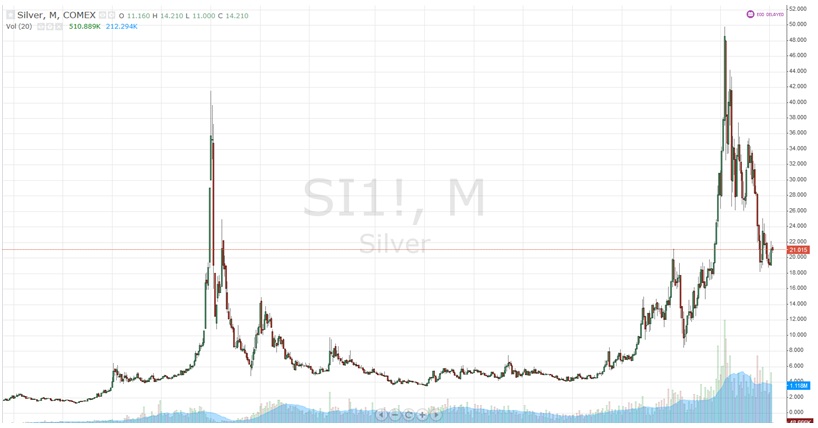
Silver Future, Monthly Chart 1968-2014
Learning from the Past
Based on what we have seen since the early 1970’s, we can conclude that silver can lie dormant for long periods during which there is relative global economic stability before exploding with parabolic price rises during periods of crisis and uncertainty, and then finally falling off back to its original levels pretty rapidly. It is a similar story to Gold, and these two precious metals have historically been very highly correlated, although Gold has shown a greater volatility and has attracted the lion’s share of speculative interest in precious metals. There is no reason why this pattern should change in the future. So anyone speculating in Silver is probably going to be best served by buying when there is strong fear of a global economic crisis or “black swan” events, and then selling when the fear subsides. Following shorter-term purely technical strategies is likely to produce a far less profitable income.
If we follow the model of looking to the past, the big question is whether we are going to see a repeat over the next few years of what happened during the 1980s as global economic sentiment moved from crisis to a perception of solidity and continuity. So far, it could be said despite the bull market there is still much more fear than there was in the mid-1980s. This might mean that Silver’s decline will not quite match what occurred during the 1980s. If it were to follow the same pattern, we could expect a continued fall in the price of Silver during the next few years to a price approaching $10, representing a further steep decline of 50%.
Speculators feeling that the world is in for some more financial shocks and panics over the next few years should expect this natural falling-off to be reversed. It would be logical in that case to to see Silver approach $50 again.
A Technical Analysis
It seems clear that Silver is engaged technically in a major corrective move downwards. A shorter-term technical analysis can be constructed from this starting point. A daily chart shows the downwards trend but also a major higher low which suggests we are forming a bearish narrowing triangle:

Silver Future, Daily Chart April 2013 -2014
An aggressive short entry point could be made at the next touch or confirmed rejection of the upper trend line. A more conservative approach could be to wait for a sustained break below the lower trend line of the triangle. An intermediate approach would be to wait for a new bullish inner trend line to form, and enter short upon a break down through it.
share
share
share
share
share
More from Silver Phoenix 500


