Brazilian Bovespa Technical Analysis
 share
share
 share
share
 share
share
 share
share
 share
share
 The Bovespa is the Brazilian stock index and is based out of Sao Paulo. Let’s take a top down approach to the technicals beginning with the yearly chart.
BOVESPA YEARLY CHART

We can see price made an all time high at 73920 in 2008 and has not traded above there since although it went close in 2010. Since then price has been retreating.
The Relative Strength Indicator (RSI) is still in positive territory but seemingly trending down. This actually looks pretty good considering price has not hit new yearly highs in a round six years.
The Stochastic indicator still has a bearish bias so there looks to be further downside in store.
As for where the final pullback low might be, I have added Fibonacci retracement levels of the move up from the 1998 low to 2008 high. A move back to the 61.8% level at 31066 would mean the 2008 low holds. This can be seen in the green highlighted circle. However, I suspect that low will give way as price makes its way towards the 76.4% level at 20941 which can be seen in the yellow highlighted circle.
Let’s move on to the monthly chart.
BOVESPA MONTHLY CHART
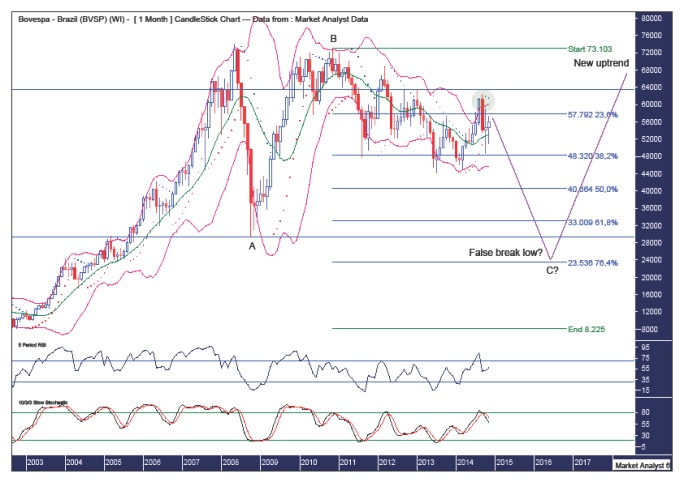
I have added some different Fibonacci retracement levels using the range from the 2002 low to 2008 high. My preference is for the 2008 low to be taken out as price pulls back to the 76.4% level at 23536. This sets up the potential for a false break low as this is not far below the 2008 low. I prefer this Fibonacci setup to that outlined in the yearly analysis. Let’s see.
I suspect an ABC corrective move is in play from the 2008 high. Wave A and B are already in place with wave C now in progress. Once the wave C low is in place I will be looking for a new uptrend to commence that takes price to all time highs. All in good time.
I have added the Parabolic Stop and Reverse (PSAR) indicator which pertains to the dots and we can see price busted these dots to the downside a couple of months ago. So there is now a bearish bias in force but as often happens after an initial bust of PSAR resistance, price then trades back up to test the dots which are now on the upside. This PSAR resistance is now at 61634 and I doubt price will trade above there. Why?
I have added Bollinger Bands which show the recent high in September trading well above the upper band. Highs are often made when price trades well above the upper band and I expect this time to be no different.
Also, there is a clear pattern of lower highs and lower lows since the wave B high in 2010. Apart from the recent high, the previous swing high was in September 2012 at 63428 and is denoted by the horizontal line. Breaking this level is the first step needed to get the bullish case back on track.
The recent high was accompanied by an overbought RSI reading while the Stochastic indicator is showing a recent bearish crossover.
Let’s finish off the analysis by looking at the weekly chart.
BOVESPA WEEKLY CHART

Price has been trending up since the middle of the year and it looks like this trading has been part of an ABC corrective pattern. This looks to be complete with the wave C high in September at 62305.
The PSAR indicator shows price recently busting the dots to the upside so more upside looks likely.
The Bollinger Bands show price moving away from the lower band and now milling around the middle band. Perhaps price tests the recent high and finds resistance at the upper band.
And if price turns back down after failing to break to new highs then new lows should be seen.
The Stochastic indicator still has a bullish bias while the Moving Average Convergence Divergence (MACD) indicator is showing a recent bullish crossover so the weeks ahead look positive for price.
The Brazilian stock carnival has been quite subdued in recent times and I’m not expecting the samba to heat up any time soon. But the sun will shine again. Fique tranquilo! (Stay calm)
********
Disclaimer: The above is a matter of opinion provided for general information purposes only and is not intended as investment advice. Information and analysis above are derived from sources and utilising methods believed to be reliable, but we cannot accept responsibility for any losses you may incur as a result of this analysis. Individuals should consult with their personal financial advisors. Put simply, it is JUST MY OPINION.
share
share
share
share
share
More from Silver Phoenix 500


