Crude Oil…Double Top Or Further Rally?
 share
share
 share
share
 share
share
 share
share
 share
share

Trading position (short-term; our opinion): No positions are justified from the risk/reward perspective. In other words, we think that taking profits off the table and closing the previous long positions is a good idea.
On Tuesday, crude oil gave some of earlier gains after news that Iran and Libya have continued to increase production. In these circumstances, light crude slipped to the previously-broken resistance zone, but then closed the day above it. Is this a verification of the breakout?
Let's jump into the charts and try to find out what can we expect in the coming days (charts courtesy of http://stockcharts.com).
On Monday, we wrote the following:
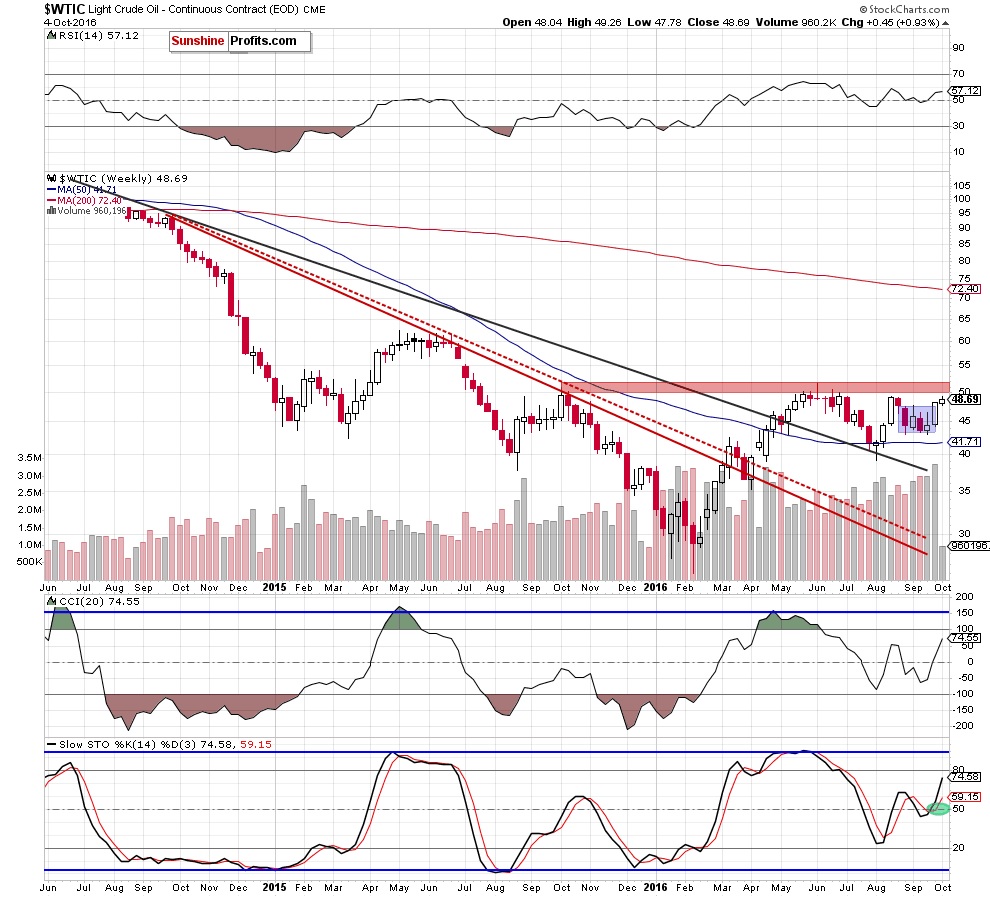
(...) crude oil broke above the upper border of the blue consolidation, which is a positive event that suggests further improvement in the coming week. Additionally, the Stochastic Oscillator generated a buy signal and the size of the volume that accompanied last week's upward move was huge (the biggest in more than two years), which confirms oil bulls' strength and supports higher prices of the commodity (in our opinion, light crude will test the red resistance zone marked on the weekly chart) in near future.
Yesterday, we added:
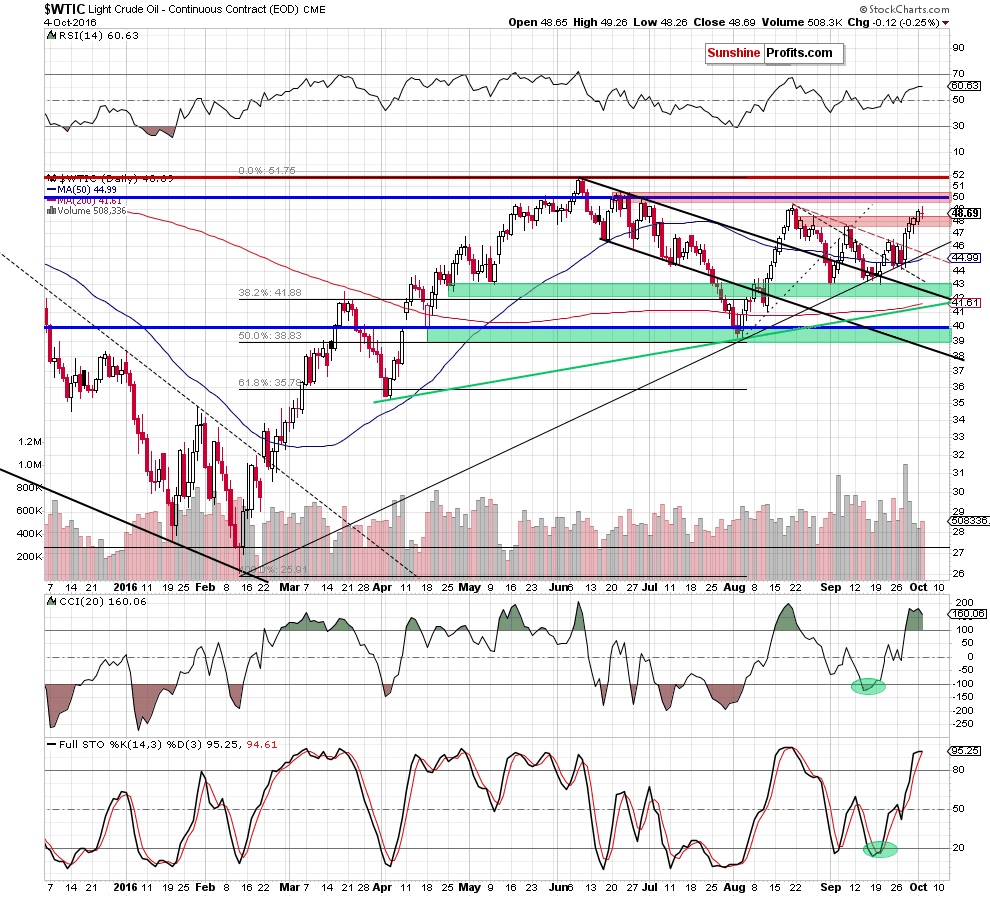
(...) oil bulls pushed the commodity higher as we had expected. Thanks t yesterday's increase light crude broke above the upper border of the red resistance zone, which means that (...) the next upside target would be the barrier of $50.
Looking at the above charts from today's point of view, we see that crude oil extended gains (in line with our assumptions) and hit an intraday high of $49.26 yesterday. Despite this improvement, the proximity to the Aug high and the barrier of $50 triggered a small pullback (compared to earlier increases), which took the commodity to the previously-broken upper border of the red resistance zone.
What's next? Taking into account the fact that light crude rebounded from session's low and closed the day above the first red zone, we think that yesterday's move was just a verification of earlier breakout above this area. If this is the case, we should see further improvement and a climb to our next upside target in the coming day.
Nevertheless, at this point we would like to draw your attention to several disturbing factors. Firstly, when we take a closer look at the daily chart, we notice that the size of volume that accompanied recent increases was decreasing in each passing day (since Sep 28). Additionally, yesterday's small drop materialized on bigger volume than Friday's or Monday's upswing. This suggests that oil bulls may begin to lose their strength, which could translate into correction in the following days.
Secondly, the CCI and Stochastic Oscillator are overbought and remain at the highest levels since Sep high, which can encourage oil bears to act – similarly to what we saw several weeks ago.
Thirdly, we should keep in mind that crude oil approached a very solid resistance zone created by the Jun highs, the barrier of $50, the Oct 2015 peaks and the 2016 high (around $49-$51.67). As you see this area was strong enough to stop the rally in Aug, which in combination with all the above-mentioned factors can cause that history will repeat itself and we'll see a correction (even if light crude moves little higher from current levels and test the strength of the next red zone first) in very near future.
On top of that when we examine the current situation in the oil-to-gold, oil-to-stocks and oil-to-oil stocks ratios (more about these and other interesting ratios you can know from our monthly Oil Investment Updates), we can add more negative factors.

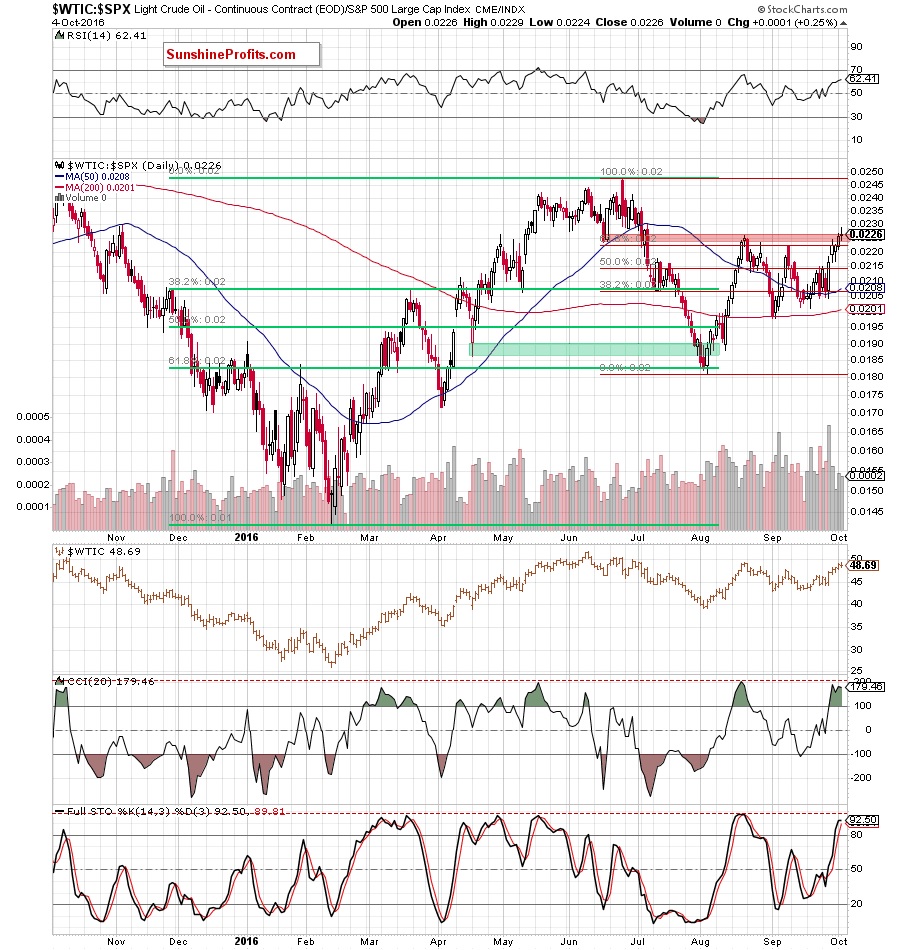
On the above chart, we see that the oil-to-gold ratio extended gains and almost touched the upper blue resistance line (a neck line of a potential reverse head and shoulder formation), which suggests that the space for gains may be limited. However, even if the ratio climbs little higher from the current levels, we think that as long as there won't be a breakout above the May high and the red resistance zone another sizable move to the upside (in the ratio and also in crude oil) is not likely to be seen and reversal should not surprise us.
Having said the above, let's zoom in our picture and find out how recent increases affected the daily chart.
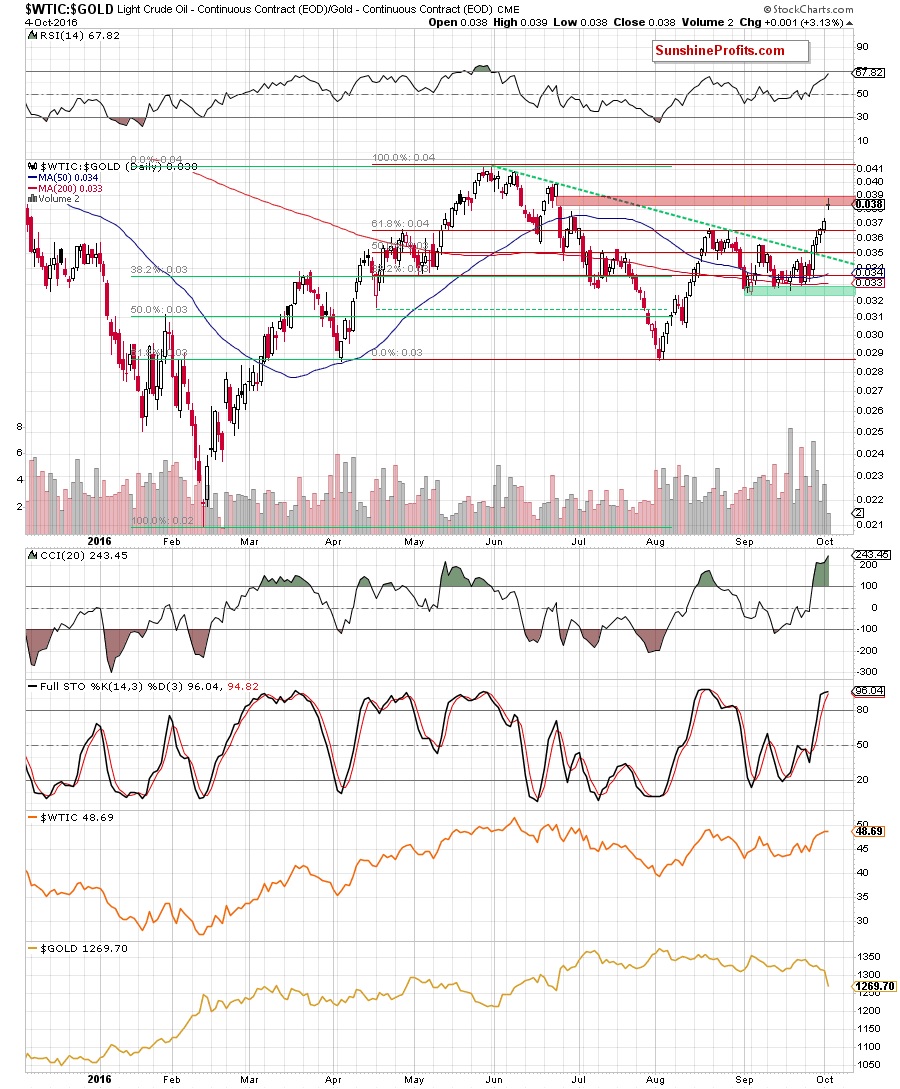
From this perspective, we see that although the ratio gained over 3% and created a gap yesterday, the red resistance zone (created by the Jun gap) continues to keep gains in check. On top of that, the size of Tuesday's volume was tiny, which in combination with the current position of the indicators increases the probability of reversal in the coming days.
What can we infer from the relationship between crude oil and the general stock market? Let's examine the charts and find out.
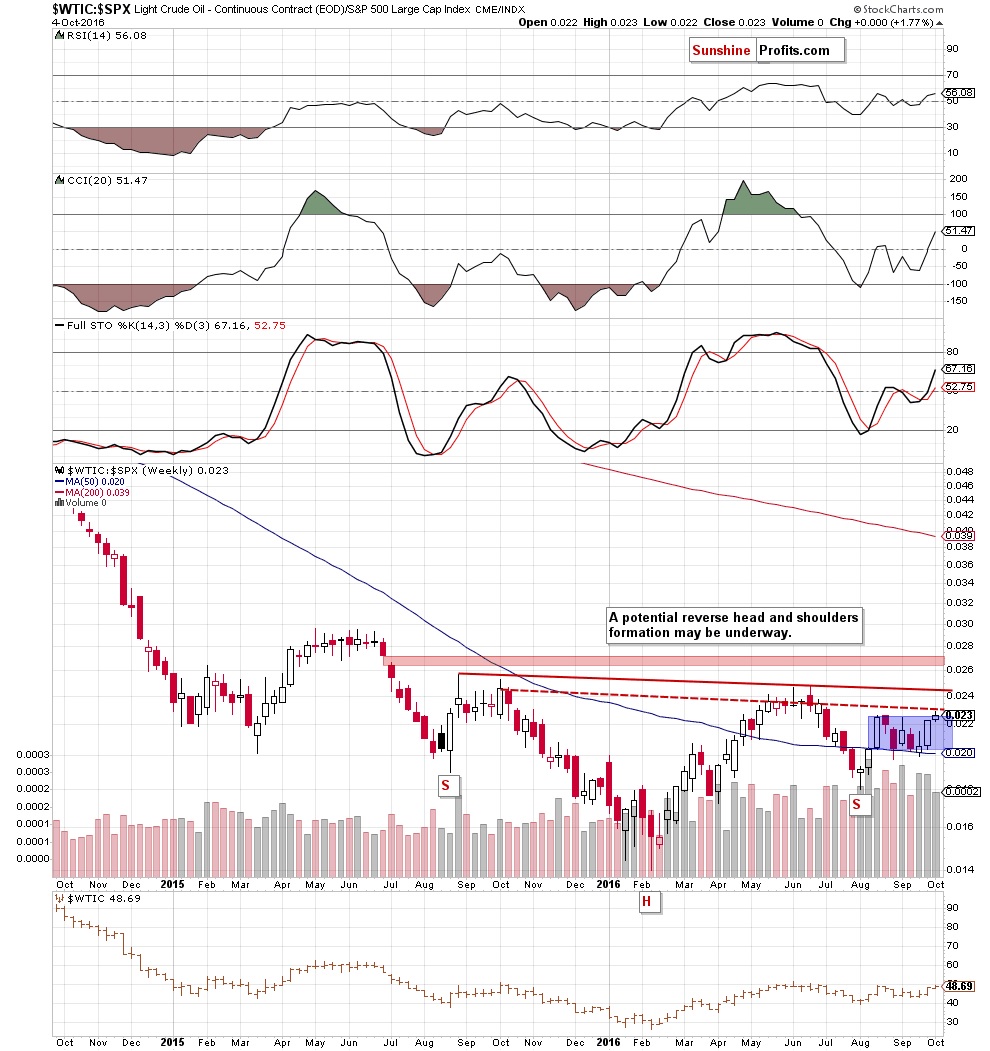
Looking at the weekly chart, we see that the ratio increased slightly above the upper border of the blue consolidation and reached the red dashed line based on the weekly closing prices. As you see this resistance was strong enough to stop increases in May and Jun, which suggests that we can see similar price action this week.
Additionally, when we focus on the very short-term chart below, we'll see that the ratio invalidated yesterday's breakout above the Aug high, which is an additional negative factor.
On top of that, the size of volume doesn't confirm the strength of the recent increases, while the CCI and Stochastic Oscillator are overbought (similarly to what we saw several weeks ago), which suggests that reversal is just around the corner.
Finishing today's alert, let's take a look at the oil-to-oil stocks ratio.
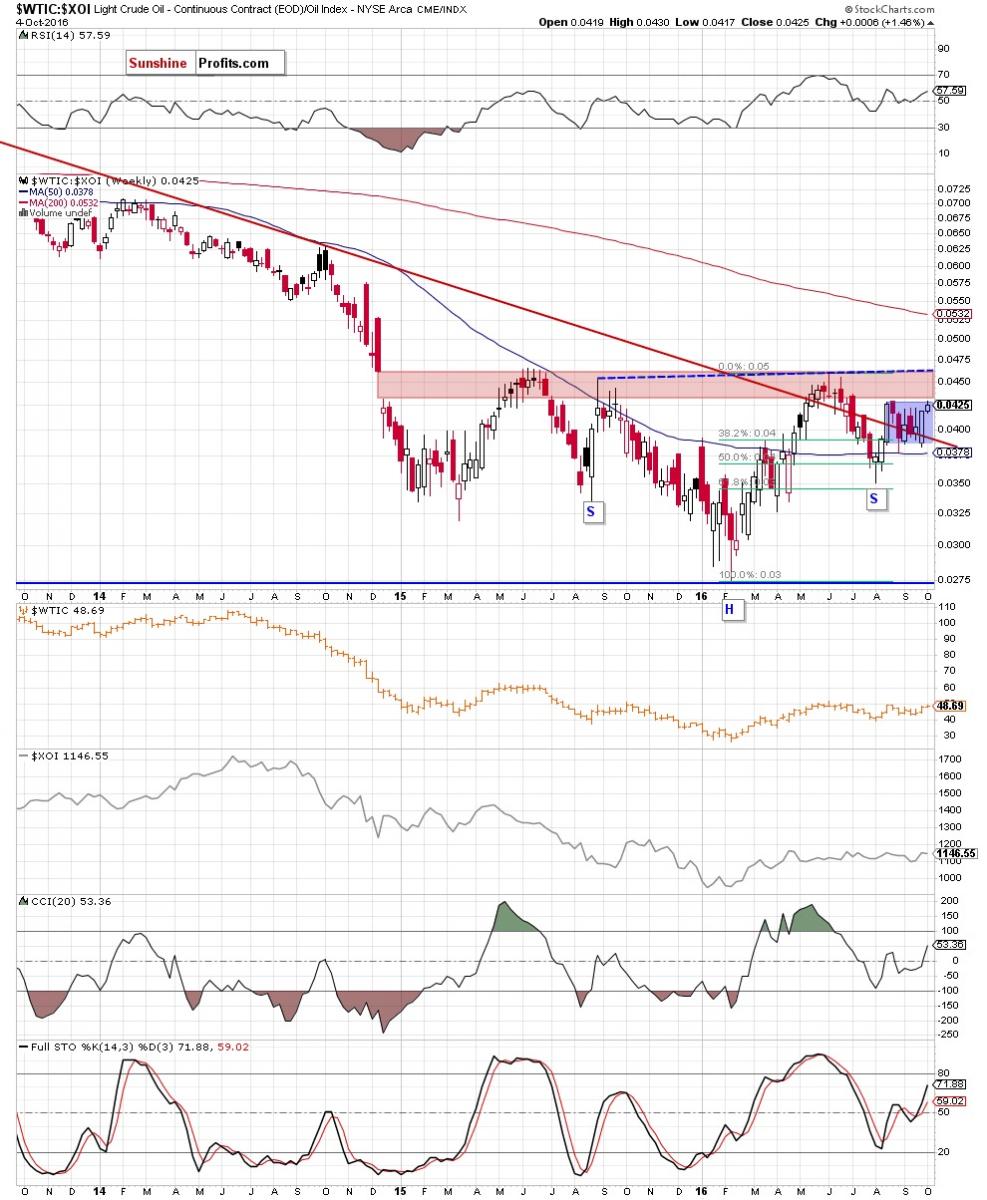
On the above chart, we see that the ratio not only reached the upper border of the blue consolidation, but also the key red resistance zone, which continues to keep gains in check since Dec 2014. Taking this fact into account, we think that even if the ratio (and crude oil as positive correlation remains in place) extends gains from here, as long as there won't be a breakout and a weekly closure above the upper border of the zone (which is currently reinforced by the neck line of a potential reverse head and shoulders) further rally is not likely to be seen and another reversal is very likely.
Summing up, crude oil moved little lower and slipped to the previously-broken upper border of the first resistance zone on Tuesday, which looks like a verification of earlier breakdown. If this is the case, we'll see further improvement and a test of our next upside target- the barrier of $50. Nevertheless, the current picture of the oil market that emerges from our ratios suggests that the space for gains may be limited and reversal is just around the corner. Therefore, in our opinion, closing short positions (we opened them on Sep 22 when crude oil was trading around $45.60) and taking profits off the table is the best decision at the moment.
Very short-term outlook: mixed with bullish bias
Short-term outlook: mixed
MT outlook: mixed
LT outlook: mixed
Trading position (short-term; our opinion): No positions are justified from the risk/reward perspective. We will keep you informed should anything change, or should we see a confirmation/invalidation of the above.
********
Courtesy of http://www.sunshineprofits.com/
share
share
share
share
share
More from Silver Phoenix 500


