Forex Trading Alert: GBP/USD – Breakout or Fakeout?
 share
share
 share
share
 share
share
 share
share
 share
share
Earlier today, the British pound extended gains and hit a 4-1/2 year high against the greenback as upbeat U.K. employment data released on Wednesday still weighted on the pair. Thanks to these circumstances, GBP/USD broke above the important resistance zone. Despite this bullish sign, the exchange rate reversed. Will the buyers manage to close the day above the previous 2014 high?
In our opinion, the following forex trading positions are justified - summary:
- EUR/USD: none
- GBP/USD: short (stop-loss order: 1.6855)
- USD/JPY: none
- USD/CAD: none
- USD/CHF: none
- AUD/USD: none
EUR/USD
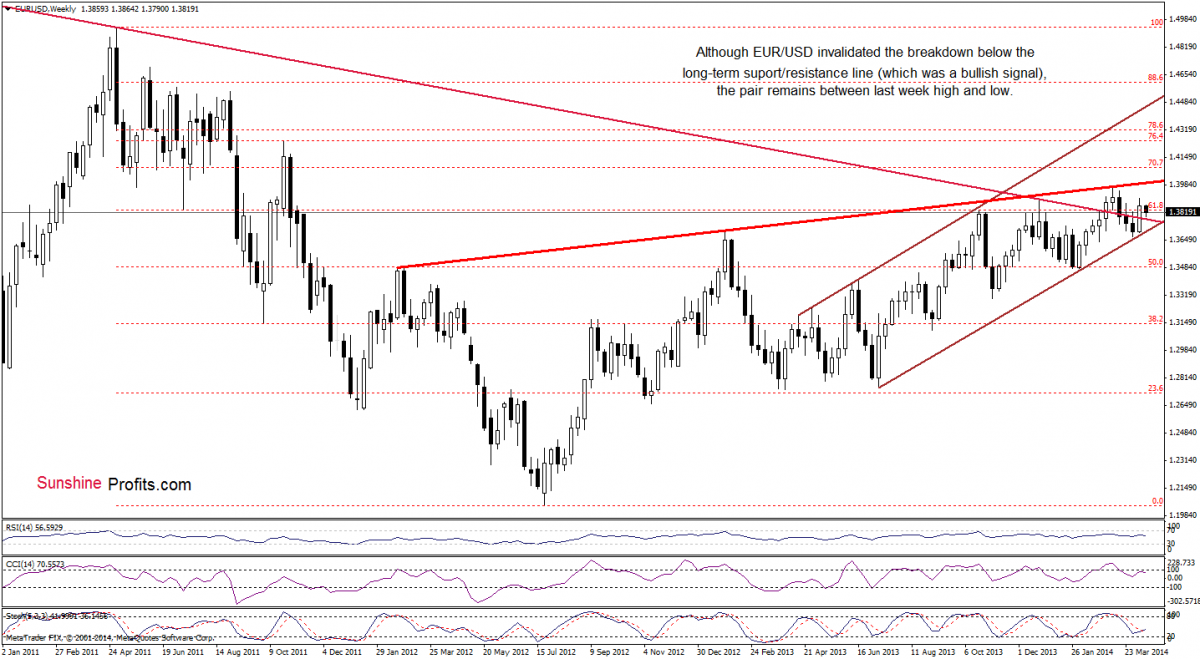
From the weekly perspective, we see that the situation hasn’t changed much. Therefore, what we wrote in our previous Forex Trading Alert is still up-to-date.
(…) EUR/USD still remains above the previously-broken long-term declining resistance line and the lower border of the rising trend channel (marked with brown). (…)
These two important lines still serve as major support. As you see on the above chart, the exchnge rate remains below the 2014 high and the rising resistance line (marked with red), which succesfully stopped growth in the previous month. From this perspective, it seems that as long as these key lines are in play, a bigger upward or downward move is not likely to be seen.
Once we know the above, let’s take a look at the daily chart.
Quoting our previous Forex Trading Alert:
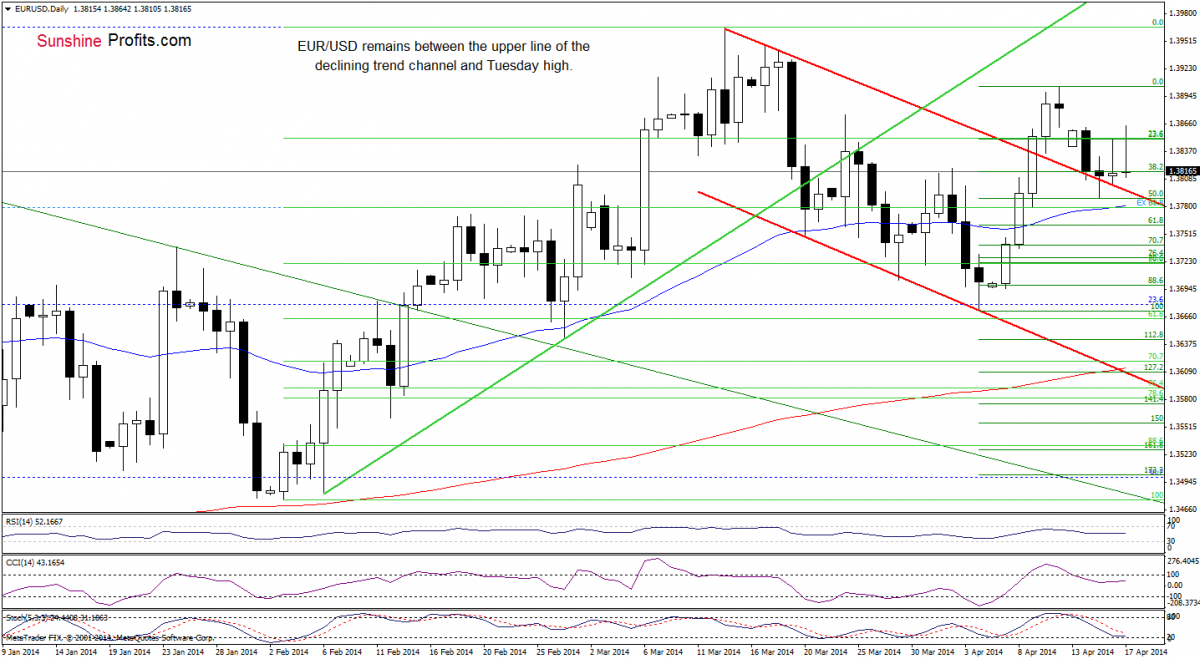
(…) the exchange rate rebounded and erased 50% of the recent decline. If the buyers do not give up, we may see further improvement and an increase to Monday high of 1.3862.
Looking at the above chart, we see that the buyers realized this bullish scenario earlier today. Despite this improvement, they didn’t managed to hold gained levels and the exchange rate declined (which is not a positive signal). As you see on the above chart, with this downswing, the pair dropped to around yesterday’s closing price. Taking into account the position of the indicators (sell signals remain in place) we see that they still favor sellers, which suggests that another attempt to break below the upper line of the declining trend channel should not surprise. If this is the case, the first downside target will be the 50-day moving average (currently at 1.3780). If it is broken, we will likely see a drop to around 1.3777, where the long-term declining line is.
Very short-term outlook: bearish
Short-term outlook: bearish
MT outlook: bearish
LT outlook: bearish
Trading position: In our opinion no positions are justified from the risk/reward perspective. We are not opening short positions just yet, because of the divergence on the long-term charts (we wrote more about this situation in our Forex Trading Alert posted on Thursday), however we will quite likely open it once we see some kind of confirmation.
GBP/USD

From the weekly perspective, we see that GBP/USD climbed higher and hit a fresh 2014 high. Despite this bullish sign, the exchange rate still remains below the strong resistance zone created by Aug. and Nov. 2009 highs, which may pause or even stop further improvement.
To have more complete picture of the current situation in GBP/USD, let’s take a look at the daily chart.
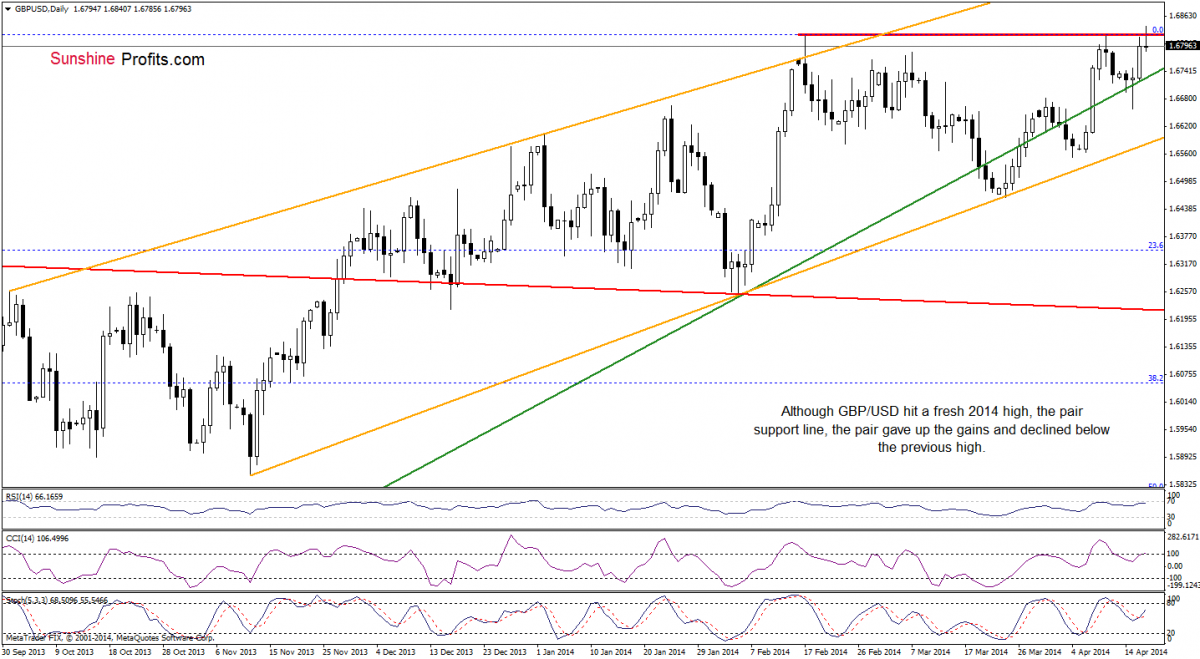
On the above chart, we see that GBP/USD extended gains and broke above the resistance zone created by April and 2014 highs. However, as it turned out in the following hours, the pair reversed and slipped below the previous highs, invalidating earlier breakout. An invalidation of a breakout is a bearish signal, which might trigger a bigger decline. If this is the case, the initial downside target for the sellers will be the previously-broken green medium-term support line (currently around 1.6727).
Very short-term outlook: bearish
Short-term outlook: mixed with bearish bias
MT outlook: bearish
LT outlook: mixed
Trading position (short-term; our opinion): Short. Stop-loss order: 1.6855. Please note that if the pair moves above our stop-loss level, it seems that it will rally some more before heading south once again. If this is the case, we’ll consider re-opening short positions around the 2009 high.
USD/JPY
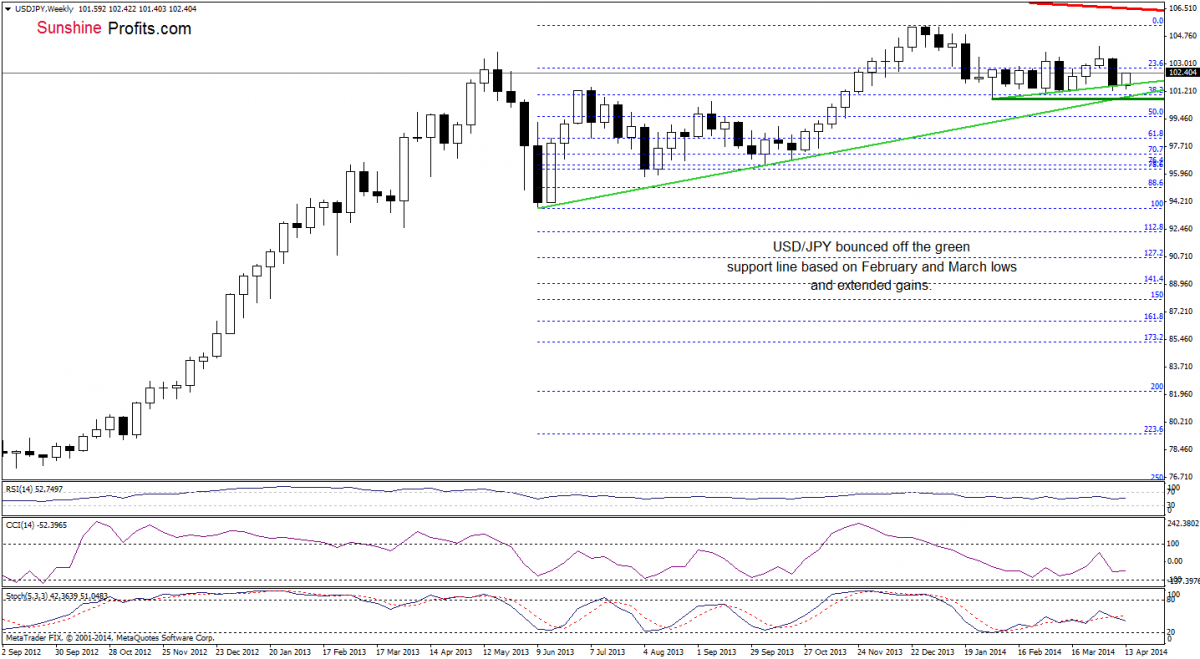
From the weekly perspective, we see that the situation has improved slightly as USD/JPY extended gains. Similarly to what we wrote yesterday, if the buyers do not fail, we will likely see further improvement. Where the exchange rate could climb in the coming days? Let’s take a look at the daily chart.
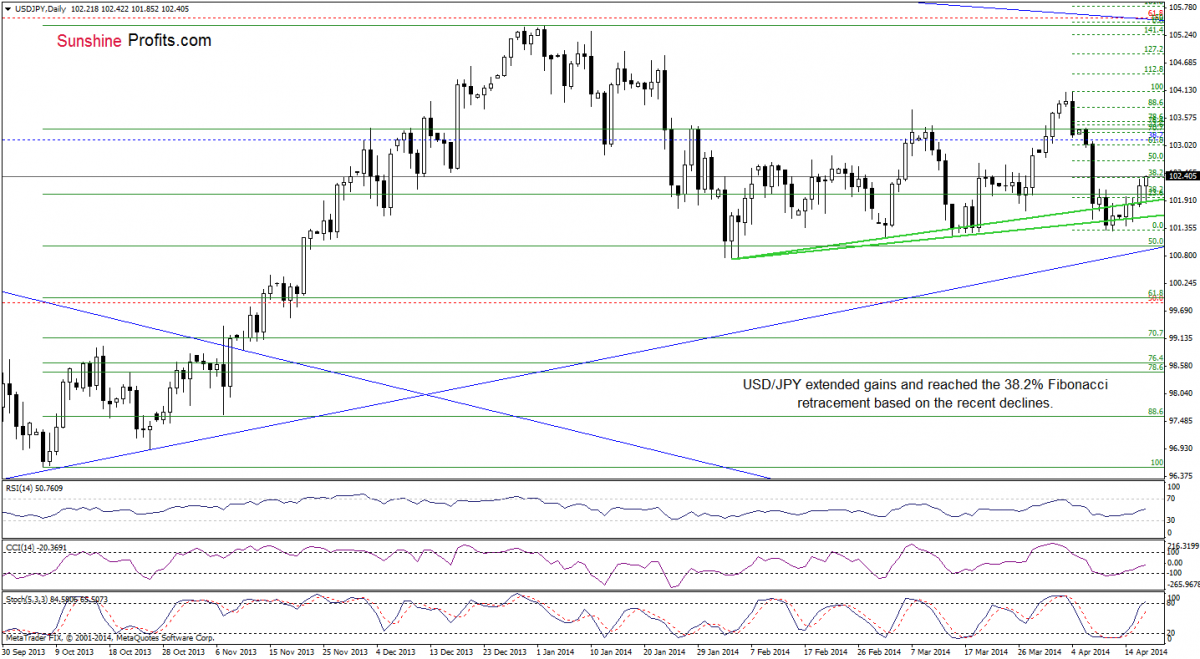
Quoting our previous Forex Trading Alert:
(…) the buyers finally managed to push USD/JPY above this resistance, which is a bullish signal. Taking into account the fact that buy signals generated by the indicators remain in place, we may see further improvement. In this case, the initial upside target will be around 102.70, where the 50% Fibonacci retracement based on the recent decline is. If it is broken, the next target for the buyers will be slightly below the April 8 high - around 103.03 (the 61.8% retracement).
As you see on the above chart, the pair extended gains and climbed not only above Wednesday high, but also above the 38.2% Fibonacci retracement, which is a bullish signal. Taking this fact into account and combining with the position of the indicators, it seems that the initial upside target from our last Forex Trading Alert may be reached in the coming day (or days).
Very short-term outlook: bullish
Short-term outlook: mixed with bullish bias
MT outlook: bullish
LT outlook: bearish
Trading position (short-term): In our opinion no positions are justified from the risk/reward perspective at the moment.
USD/CAD
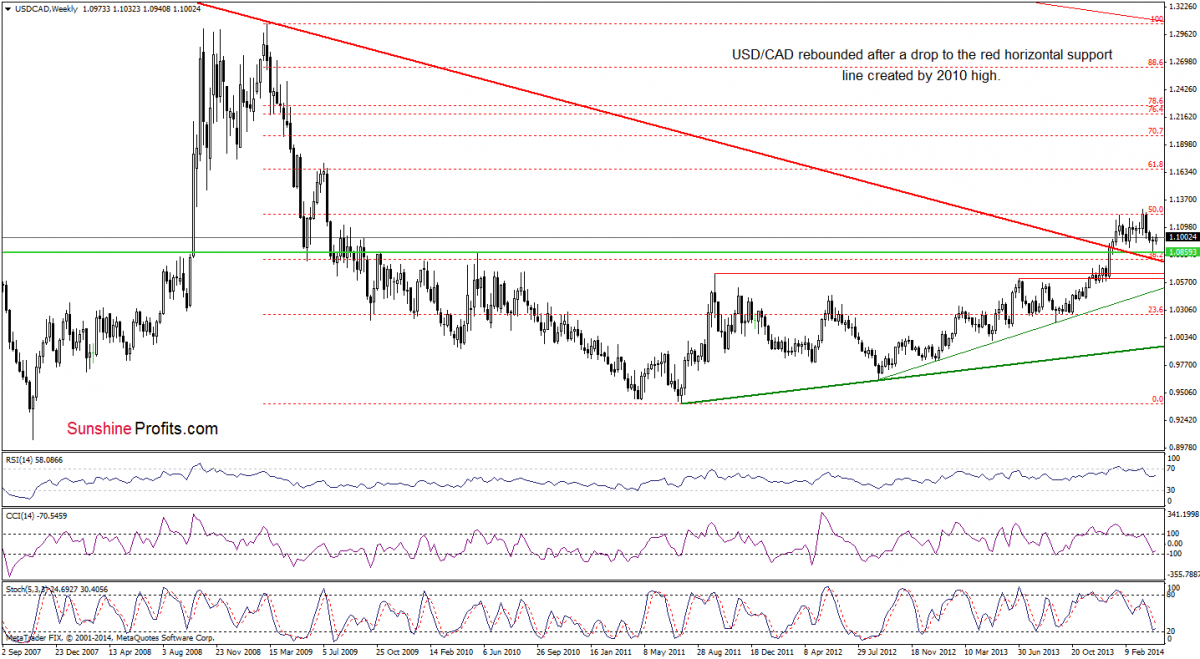
Looking at USD/CAD from the weekly perspective, we see that the situation hasn’t changed. So, what we wrote yesterday is still valid.
(…) although the exchange rate declined in the previous weeks, it still remains above the previously-broken long term declining support/resistance line (marked with red). With this downward move, the pair declined to the horizontal green support line (created by the 2010 high) and rebounded. Nevertheless, the size of the corrective upswing is still quite small, which suggests that another attempt to move lower can’t be ruled out.
Before we summarize this currency pair, let’s move on to the daily chart.
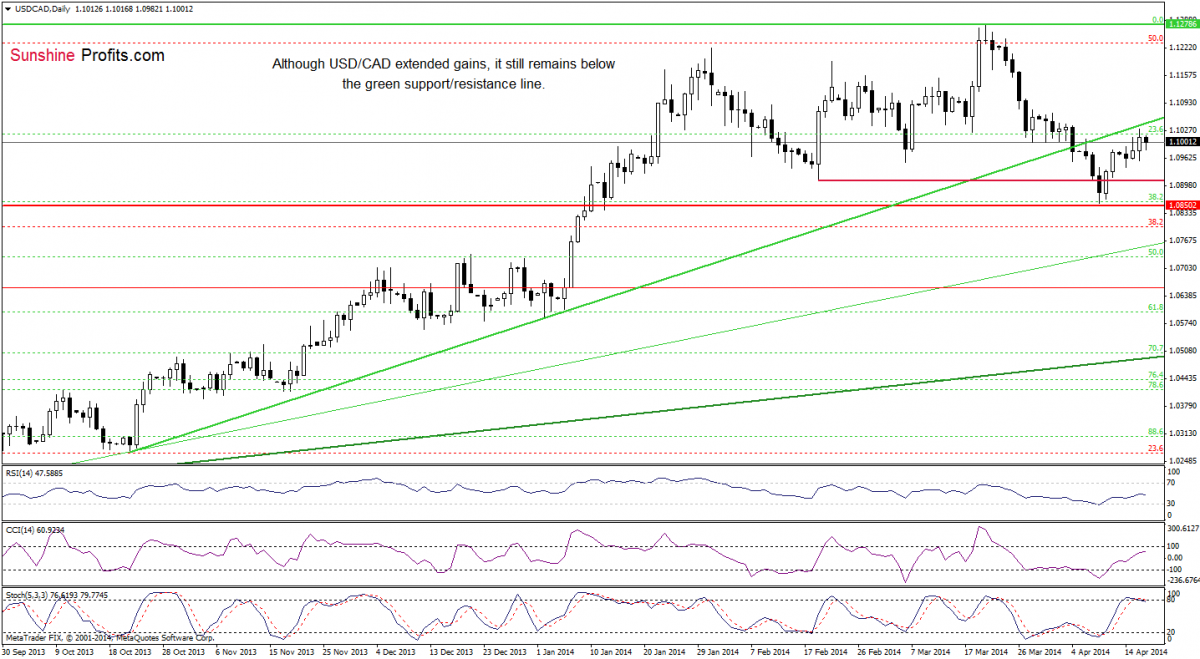
In our previous Forex Trading Alert, we wrote the following:
(…) if the buyers manage to push the exchange rate higher, we may see an increase to the major resistance line (currently around 1.1026). Please note that the pro growth scenario is reinforced by the current position of the indicators (the RSI bounced off the level of 30, while buy signals generated by the CCI and Stochastic Oscillator remain in place).
As you see on the above chart, the buyers almost realized this bullish scenario yesterday. Despite this improvement, they didn’t manage to hold gained levels and the exchange rate reversed earlier today. Although the proximity to the resistance line encouraged sellers to act, the pair still remains between yesterday’s high and low. On one hand, if USD/CAD moves above Wednesday high, we may see another attempt to break above the green resistance line. On the other hand, if the pair drops below yesterday’s low, we will likely see a pullback to around 1.0909 (where the Feb.19 low is) or even to the April low of 1.0857.
Very short-term outlook: mixed
Short-term outlook: mixed
MT outlook: bullish
LT outlook: bearish
Trading position (short-term): In our opinion no positions are justified from the risk/reward perspective at the moment.
USD/CHF
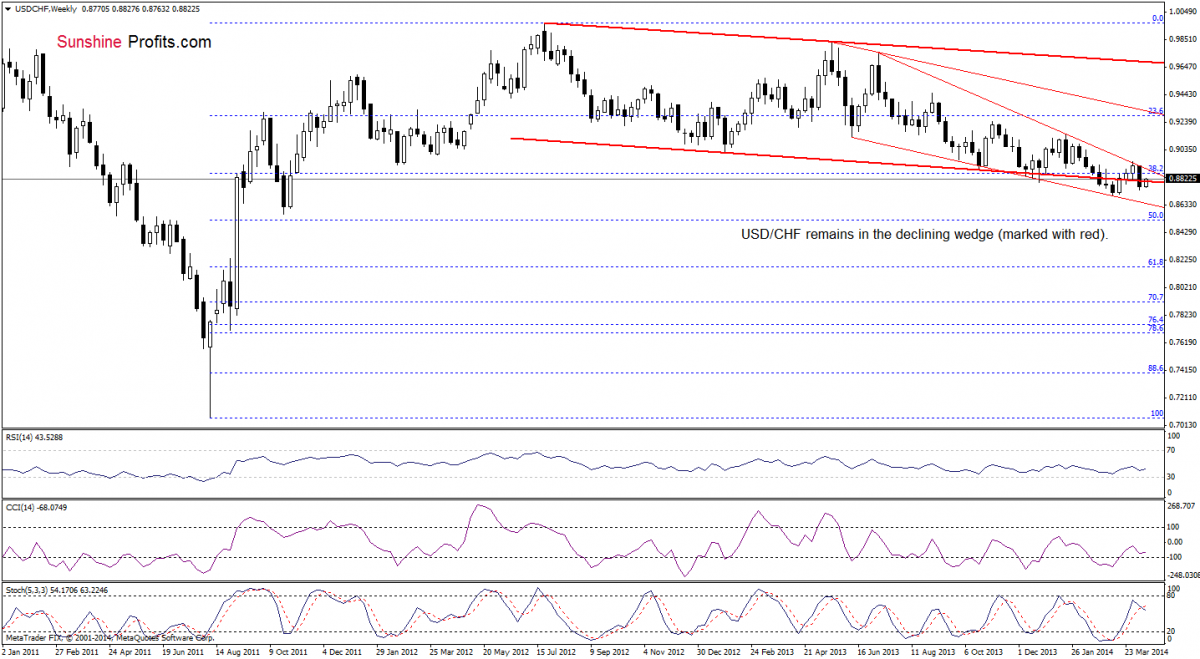
From the weekly perspective, we see that USD/CHF has been trading in the declining wedge since July. As you see on the above chart, the pair rebounded in March after a drop to the lower border of the formation, which resulted in further improvement and an increase to the upper line. However, this resistance stopped gains and triggered a decline that took the exchange rate below the lower border of the declining trend channel (marked with red). Despite this drop, the buyers didn’t give up and USD/CHF increased this week. Nevertheless, we should keep in mind that even if the exchange rate climbs higher, the space for further increases may be limited by the upper line of the declining wedge (currently around 0.8900).
Once we know the above, let’s take a closer look at the daily chart.
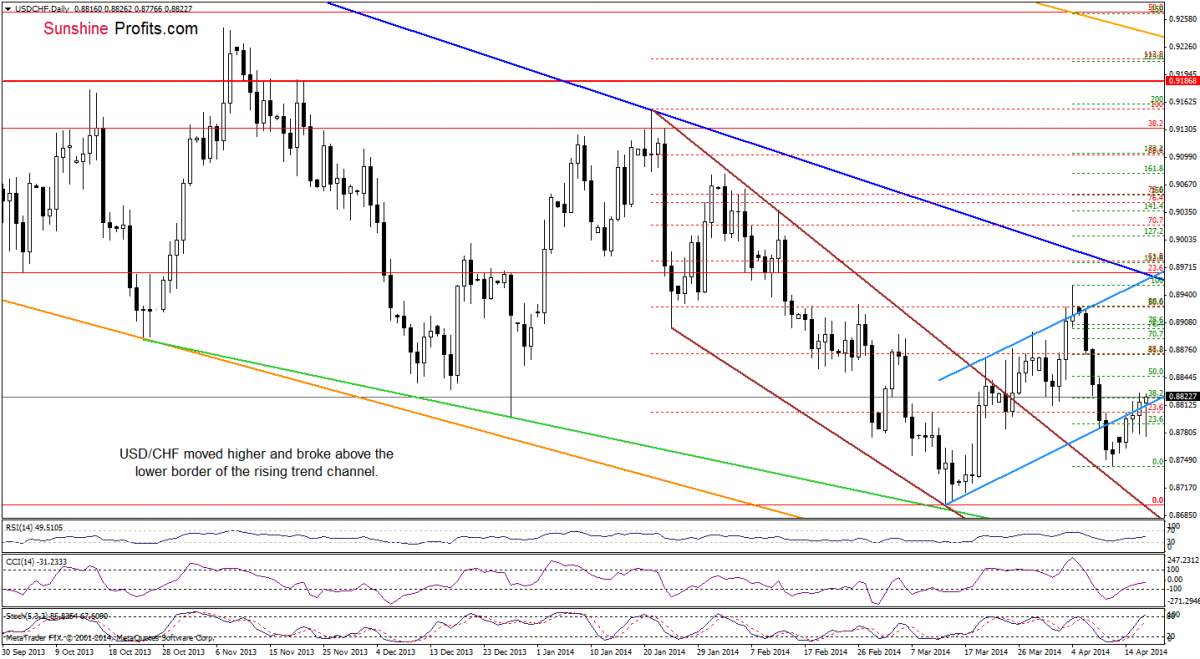
As you see on the above chart, the buyers managed to close the previous day above the lower border of the blue rising trend channel, which was a bullish signal. Although USD/CHF slipped below this support line, the pair reversed and rebounded earlier today. With this upswing, the exchange rate not only erased earlier losses, but also reached yesterday’s intraday high. As you see on the daily chart, this area is reinforced by the 38.2% Fibonacci retracement based on the recent decline. If it holds, we may see another attempt to move below the lower border of the trend channel. However, if it is broken, we will likely see further improvement and the first upside target will be around 0.8845, where the 50% Fibonacci retracement and the Apr.9 high are. If this level is broken, the next upside target will be slightly below the Apr.8 high, where the 61.8% Fibonacci retracement is (around 0.8872).
Very short-term outlook: bullish
Short-term outlook: mixed
MT outlook: bearish
LT outlook: bearish
Trading position (short-term): In our opinion no positions are justified from the risk/reward perspective at the moment.
AUD/USD
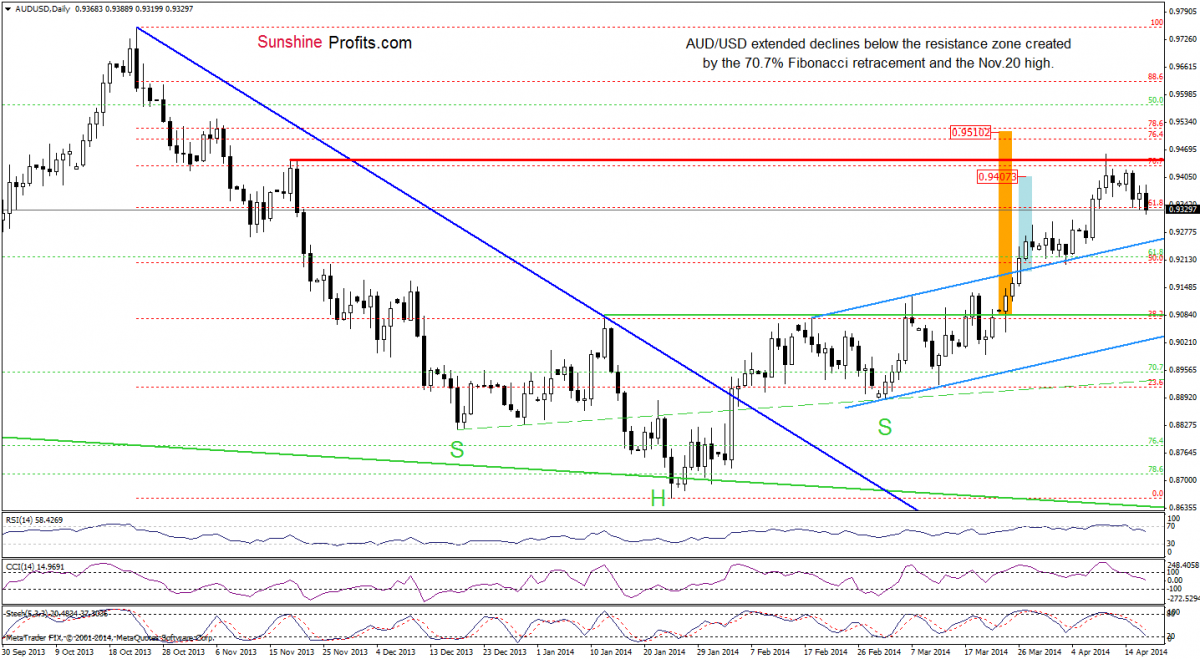
Quoting our last Forex Trading Alert:
(…) the pair still remains below the resistance zone created by the 70.7% Fibonacci retracement and the Nov.20 high. Additionally, the size of a corrective upswing is too small to say that we won’t see another attempt to move lower – especially when we factor in the current position of the indicators (sell signals remain in place and still favor sellers). As a reminder, if the exchange rate extends declines, we may see a pullback to the previously-broken upper line of the trend channel (…).
Looking at the above chart, we see that the exchange rate not only erased yesterday’s gains, but also dropped below an intraday low earlier today. As you see on the daily chart, sell signals remain in place, which suggests further deterioration and a pullback to the previously-broken upper line of the trend channel (currently around 0.9254).
Very short-term outlook: bearish
Short-term outlook: mixed with bearish bias
MT outlook: bearish
LT outlook: bearish
Trading position (short-term): In our opinion no positions are justified from the risk/reward perspective at the moment.
Thank you.
Nadia Simmons
Forex & Oil Trading Strategist
Przemyslaw Radomski
Founder, Editor-in-chief
* * * * *
Disclaimer
All essays, research and information found above represent analyses and opinions of Nadia Simmons and Przemyslaw Radomski, CFA and Sunshine Profits' associates only. As such, it may prove wrong and be a subject to change without notice. Opinions and analyses were based on data available to authors of respective essays at the time of writing. Although the information provided above is based on careful research and sources that are believed to be accurate, Nadia Simmons, Przemyslaw Radomski, CFA and their associates do not guarantee the accuracy or thoroughness of the data or information reported. The opinions published above are neither an offer nor a recommendation to purchase or sell any securities. Nadia Simmons and Przemyslaw Radomski, CFA are not Registered Securities Advisors. By reading Nadia Simmons’s and Przemyslaw Radomski’s, CFA reports you fully agree that they will not be held responsible or liable for any decisions you make regarding any information provided in these reports. Investing, trading and speculation in any financial markets may involve high risk of loss. Nadia Simmons, Przemyslaw Radomski, CFA, Sunshine Profits' employees and affiliates as well as members of their families may have a short or long position in any securities, including those mentioned in any of the reports or essays, and may make additional purchases and/or sales of those securities without notice.
share
share
share
share
share
More from Silver Phoenix 500


