Fundamentals for Uranium look great; is the Uranium Market ready to soar?
 share
share
 share
share
 share
share
 share
share
 share
share
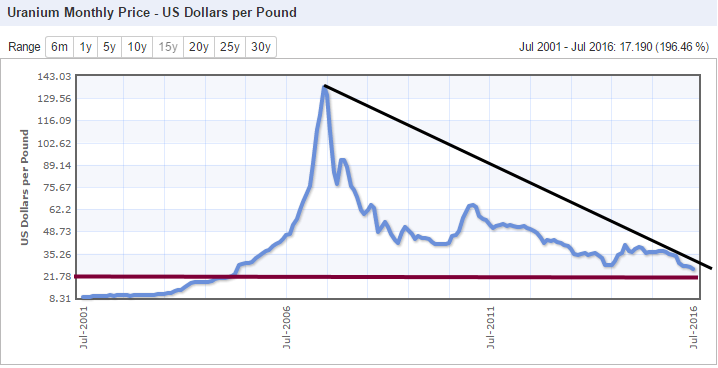
By any estimate, the uranium market is trading in the extremely oversold ranges. However, when the trend is down, a market can trend into the extreme of extremely oversold ranges, which we have seen this occur many times in the past. The 15-year chart illustrates that the next layer of support comes into play in the $21.50-$22.00 ranges, so despite being extremely oversold the market still has room to trend lower. One positive is that the trend is about to turn neutral and if it does it would be the first move into the neutral zone in a very long time.
Uranium
Source:www.indexmundi.com/
Taking a long-term view; a monthly close above $35 would be needed to indicate that a multi-month bottom is in place. From a contrarian perspective, uranium would start to look quite tempting at any level below $23.00.
Source:www.indexmundi.com/
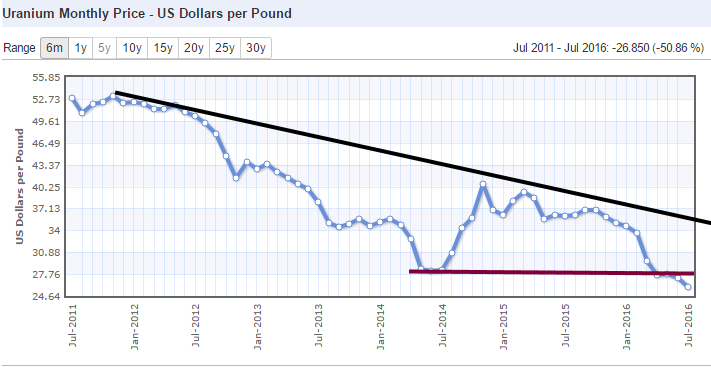
On the five year chart, Uranium is has broken through former support (27.50-28.00) now turned resistance and it appears that almost all the ingredients are in place for a test of the $21.50-$22.00ranges.
Fundamentals
Uranium costs about $60 a pound to produce and yet mining companies can barely get $30.00 a pound for it. At some point, something has got to give, and that will most likely be the mines. More and more mines will close up shop and call it quits, and it is not easy to bring an offline mine online again; it takes time to get an inactive mine back online.
Countries like Japan, Germany and a host of other nations dreaming of giving up on Nuclear energy are well just dreaming. Japan is now re-embracing nuclear, as will Germany and or any other country with hopes to wean itself away from Nuclear power. It is either Nuclear power or Coal, and since these countries claim to be fighting global warming, they will rather embrace Nuclear than coal.
From the fundamental perspective, the picture looks quite compelling, but fundamentals tend to paint a falsely positive picture. If we take a look at Cameco, one of the top players in this sector, the technical picture is far from positive. Despite trading in the oversold ranges, the stock broke down after posting a surprise second-quarter loss.
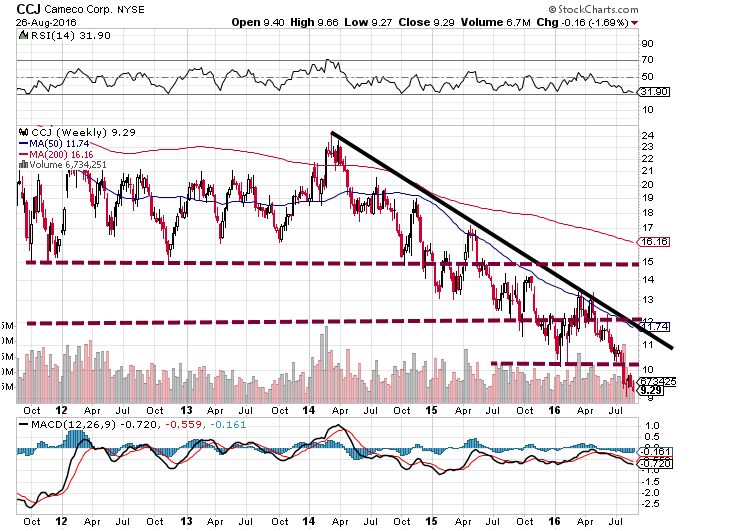
The brown dotted lines represent the multiple levels of support the stock has broken through; in fact, the stock has just traded below is 2004 lows. We would not be surprised if it dipped to $8.50 with a possible overshoot to $7.20 before a long term bottom takes hold. If uranium trades lower but Cameco’s stock price does not take the same path, it will trigger a positive divergence signals and such signals are usually indicative of a bottom.
Conclusion
Overall while there are many factors in the fundamental arena calling for a bottom, the technical and psychological patterns offer opposing viewpoints; both suggest that uranium is likely to test the $22 ranges before a long-term base in is in place. As the sector has taken a massive beating since it peaked in 2007, it would be a good idea to keep this sector on your radar and possibly start looking at some stocks in the industry.
********
Courtesy of www.tacticalinvestor.com
share
share
share
share
share
More from Silver Phoenix 500


