Gold, Silver & Oil Commodities Out Perform Their Equities?
 share
share
 share
share
 share
share
 share
share
 share
share
Since the market crash in late 2008 we have seen investors favor quality stocks that pay dividends and have steady earnings. Fast growth companies and equities with physical resources like commodities have also done well.
Let's examine the monthly charts of gold, silver, oil and natural gas - and observe how they have traded in comparison to their mining equities.
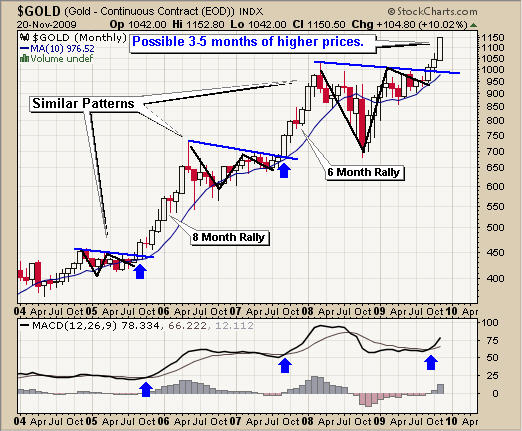
Gold - Monthly Chart
Looking at the monthly chart as far back as 2004, we see that gold has formed the same patterns repeatedly. This has created a stair step pattern and allows us to calculate measured moves and a time frame for this to take place.
As we can see gold has broken its 2008 high and is starting another rally which we have seen several times before. I figure we could see gold rally for another 3-5 months and possibly reach the $1500-$1600 level before forming a multi month or year consolidation.
Investors around the world are buying gold because it is a physical product which has been proven to hold its value.
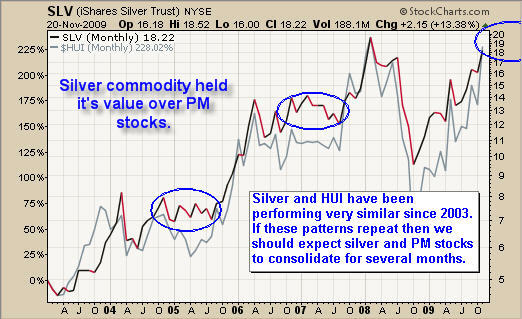
Silver & Precious Metal Stocks - Monthly Chart
Silver and PM stocks have been trading in tandem since 2004 and we can see this by looking at a price performance chart of both silver and the HUI index. The interesting part is that the physical commodity silver has held its value better than the stocks during corrections.
Apparently investors prefer tangible investments over stock certificates of mining companies in periods of increased volatility. Lower risk is in the commodity.
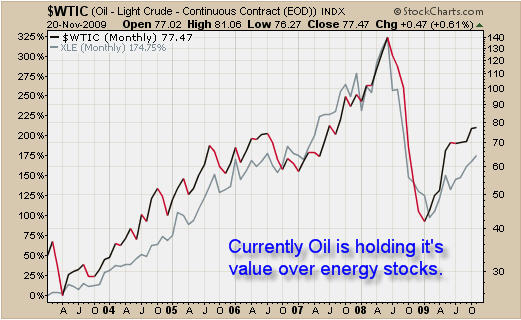
Oil - Monthly Chart
Crude oil has held its value over energy stocks for the majority of the time since 2003. And currently, investors are more comfortable holding oil as a safe investment over energy stocks.
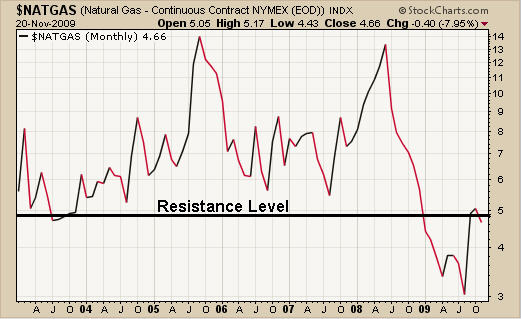
Natural Gas - Monthly Chart
Natural gas is the energy sector's underdog in my eyes. The world has found so much natural gas in the ground and discovered cost effective ways to collect gas that it will continue to see investors move away until inventory start to deplete.
Commodity Trading Conclusion
Investors around the world continue to put money into gold which is a universal hedge against inflation. The broad market appears to be trading at a major resistance level. Tops in the market generally take a much longer than to reverse directions than market bottoms. We will not knot for sure if we are entering a top for a couple months as the charts unfold. Now that commodities are trading back at reasonable levels I think they will hold up better than equities if the market starts to correct.
We continue to enter low risk setups and trade with this strong up trend but are aware that we must be protected and focus on the lower risk plays.
share
share
share
share
share

Chris Vermeulen has been involved in the markets since 1997 and is the founder of Technical Traders Ltd. He is an internationally recognized technical analyst, trader, and is the author of the book: 7 Steps to Win With Logic
Through years of research, trading and helping individual traders around the world. He learned that many traders have great trading ideas, but they lack one thing, they struggle to execute trades in a systematic way for consistent results. Chris helps educate traders with a three-hour video course that can change your trading results for the better.
His mission is to help his clients boost their trading performance while reducing market exposure and portfolio volatility.
He is a regular speaker on HoweStreet.com, and the FinancialSurvivorNetwork radio shows. Chris was also featured on the cover of AmalgaTrader Magazine, and contributes articles to several financial hubs like MoneyShow.com.
More from Silver Phoenix 500


