Long-Term Look At Gold And Silver
 share
share
 share
share
 share
share
 share
share
 share
share
Most market commentators’ focus on gold and silver, as well as with most markets, are short term. Rarely do they look back more than few years at the most. However, every now and then it is good to take a historical look at a market to see where we’ve been, to better appreciate where we are and hopefully, gain an insight to where we are heading. So, here are some charts for gold and silver going back to January 1969.
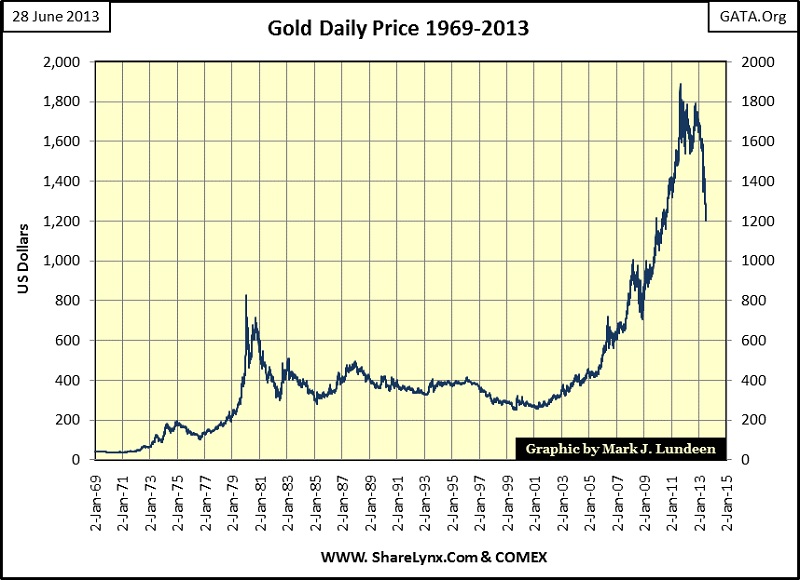
Gold’s price chart is simple to understand. In January 1969 gold was going for $43.50. Forty-two years later in August 2011, people were paying $1888.70 for it. Between 1969 and 2011 we see two bull and one bear markets in gold, and why was that? Because when the dollar was fixed at $20.67 for an ounce of gold in 1913, the United States government created their Federal Reserve, Washington’s great engine-of-inflation managed by Wall Street and academia. If gold is now selling for over $20.67 an ounce, it’s because the Federal Government allowed its central bank to over-issue the American people’s dollar. This monetary inflation created predictable problems in the economy that academia blamed on the gold standard, not the politicians, economists and bankers controlling the Federal Reserve’s “monetary policy.” So in August 1971, gold was booted out of the global monetary system, and in 2013 we are seeing problems with debt, currency and interest rates that would never be, had the US not inflated its supply of dollars in the first place.
I find it absolutely hilarious, in a morbid sort of way, that in Washington’s hallways of power, the “best and the brightest” had gold demonetized in 1971, only to have these people decide to monetize junk mortgages in 2008. Stuff like this is what the Federal Reserve’s “monetary policy” is all about. Few, if any members in the media questioned this bizarre development in the world’s reserve currency. Most members of the main-stream media can’t understand why anyone would be so stupid as to waste perfectly good paper dollars by exchanging them for gold and silver. But it’s no mystery to me why gold has soared in price since 1969. Considering what Washington and Wall Street has done, and continues to do with our money, it’s financially unhealthy to assume that ultimately, the price of gold has anywhere to go but up in terms of US dollars.
But gold has been going down for the past two years, and looking at the current decline in the price of gold, it is obvious that this is the largest dollar decline in the price of gold since 1969. I’m surprised the financial media hasn’t emphasized this fact, because it is true. Here are the gruesome dollar details the media is failing to report on. The current $688 decline in the price of gold from its last all-time high (August 2011) is its largest dollar decline in history. The second largest dollar decline occurred from March to October 2008, where gold fell $290. That makes the current dollar decline more than twice as much as the 2008 decline. But gold peaked out in March 2008 at $1003, while its current August 2011 all-time high is $1888, or 88% higher than it was in 2008. The dollar price of gold, or any other asset in a plus decade long bull market is a moving target, making declines in dollar terms deceptive from one correction to the next.
But when we look at the price of gold in a Bear’s Eye View format (BEV), which displays market movements in percentage terms bound between Zero% for new all-time highs, and -100% for a total wipeout in valuation, a different picture is revealed. Note below our current correction is only six percentage points below gold’s 29.73% correction of November 2008, and both these corrections of the current bull market are smaller than the 47% decline gold saw in August 1976. This 47% correction happened on a tiny decline of $93 for an ounce of gold.
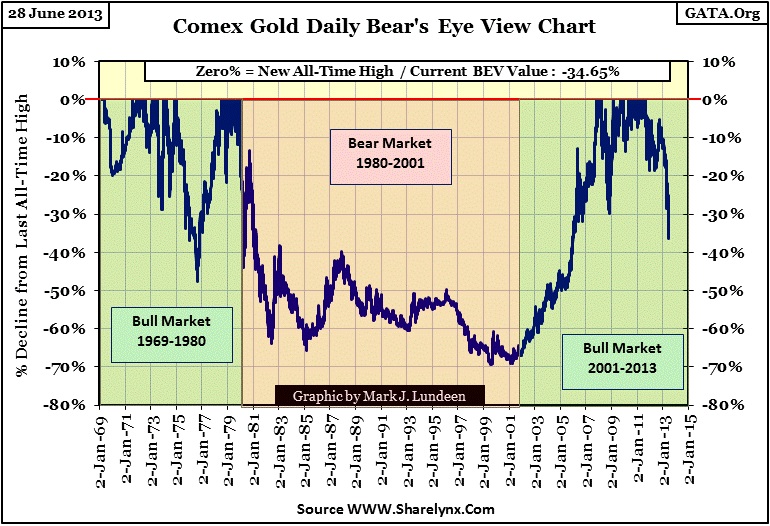
I don’t know how far the current correction will take the price of gold down. However, when gold resumes it upward price advance, it will leave its current all-time high of $1888 far behind for the simple reason that the global market will continue demanding more depreciating dollars, euros or yen to purchase an ounce of gold. No doubt we will continue seeing 30% declines in the price of gold in the years to come, I’m looking forward to the time when an $1888 decline in the price of gold only produces a 30% in the BEV chart above. That would mean that an ounce of gold has risen to $6300.
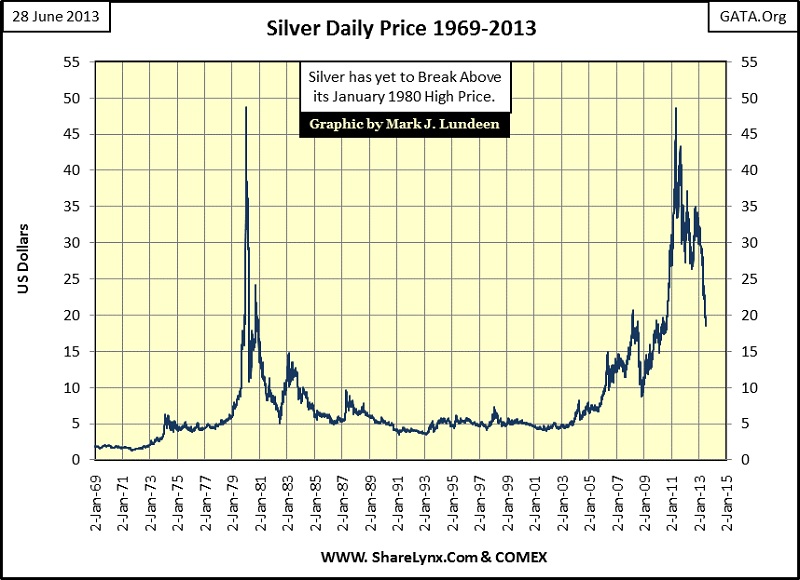
Silver’s story is completely different from gold’s. Gold is far above its highs of 1980, while silver’s last all-time high is still from January 1980. In late April 2011, the price of silver was just pennies from making a new all-time high, at which point Wall Street whacked it, taking silver down below $20 twenty six months later.
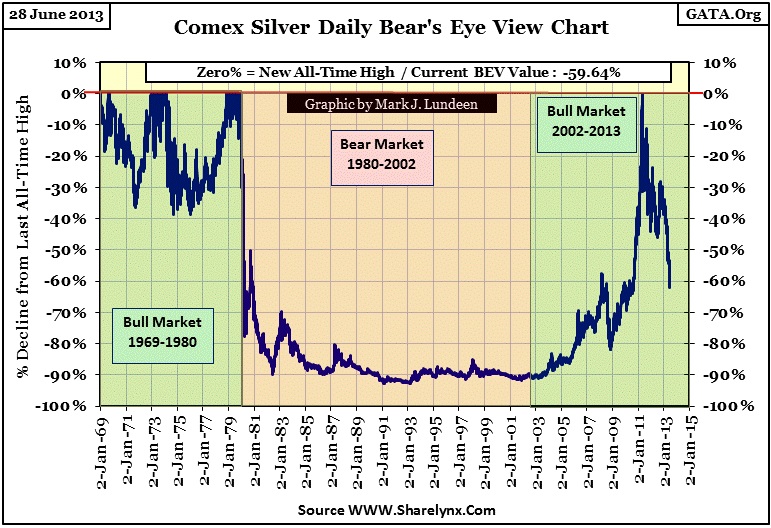
The current 62% decline in silver is the worst bull-market correction since 1969 (BEV chart below). This is horrible! Silver’s corrections from 1969-80 never declined more than 40%; note that gold saw a 47% correction in 1976. But what can we do? Recognize that silver is cheap and buy more if you can!
The gold and silver futures markets, the source of these deep declines in gold and silver, are a lawless place of trade, where anything to damage the precious metals price action to the upside is allowed. But the physical markets, where real gold and silver is actually taken in delivery are on fire. Asian demand for precious metals is so strong that Dubai’s gold market can’t fly enough gold and silver into their warehouses. As bad as it looks now, there is good reason to believe that the bull market in gold and silver still has years to go.
This is no reckless speculation on my part. Gold and silver will continue going up in dollar terms because Washington and Wall Street’s current “monetary policy” will destroy the US dollar as an economic asset. In January 2007 (six years ago), before the full impact of the mortgage bubble became known, no one could have predicted the panic purchases by the Federal Reserve we see in the chart below. It is this reckless monetization of US Treasury debt and abandoned US mortgages that will once again ignite a fire under the price of gold and silver.
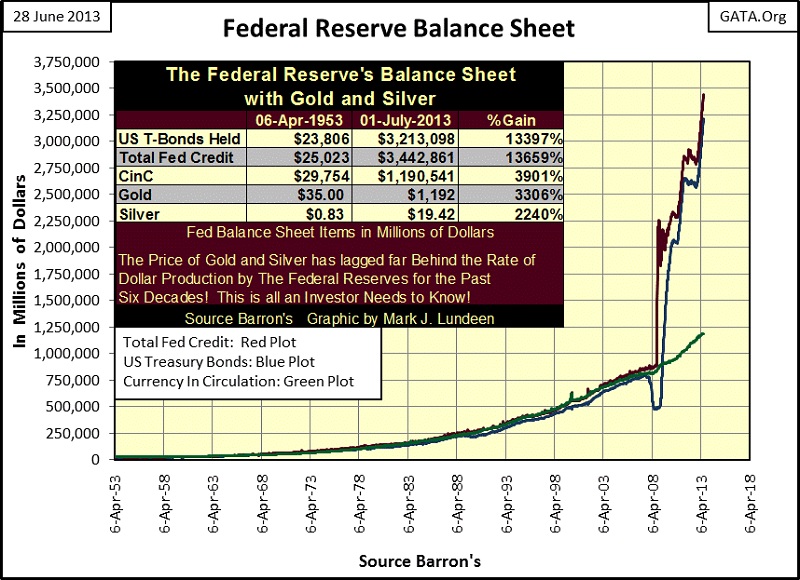
Should this massive monetization of debt continue, the US dollar has no future as an economic asset. And it will continue because the bankers, politicians and academics in control of “monetary policy” can’t think of anything else to do but print more money as a response to our current economic difficulties. Difficulties their “policies” created. At some point, we will see gold and silver soar in dollar terms that are currently not believable because of what is happening in the chart above. If the US government is currently subsidizing the gold and silver markets with artificially low prices, and the stock market with high prices; that is all the more reason to be selling stocks and buying gold and silver.
share
share
share
share
share
More from Silver Phoenix 500


