Looking At The Stock Market And Silver
 share
share
 share
share
 share
share
 share
share
 share
share
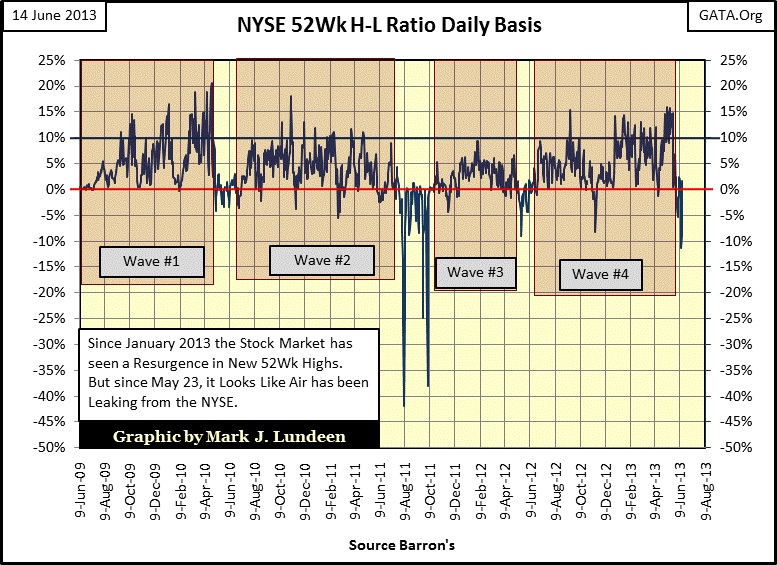
We’re almost half way through 2013, so how is the stock market doing? It could be better, and it could be worse. Here’s the chart for the NYSE’s 52Wk High-Low Ratio. I see that last Wednesday the ratio fell to -11.29%. Since the Aug - Oct 2011 market scare where the Dow Jones declined 17% we haven’t seen this ratio decline into double digits. I think it safe to say that Wave #4 is over. Question: will the NYSE 52Wk H-L Ratio now resume its pattern of more 52Wk highs than lows in a few months, or will we finally see a few months of significantly more 52Wk lows than highs as happened two years ago?
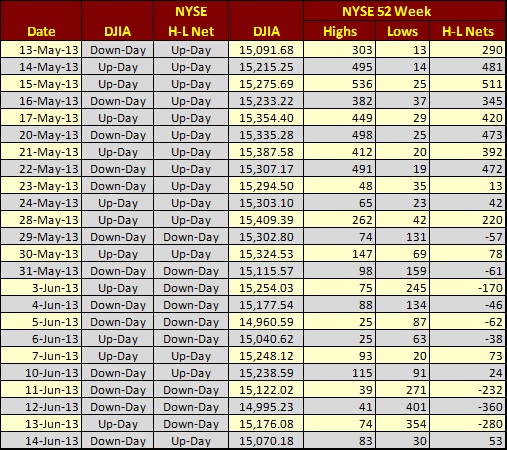
Here’s the table displaying the raw data for the past month. Look at the NYSE H-L Net column. From last November to the end of May, it’s been a continuous string of “Up-Days” except for one day in April (April 17).
Returning to the chart above to compare Wave #4 with the other post March 2009 bottom’s waves, since the beginning of 2013 the NYSE 52Wk H-L ratio regularly pierced its +10% line more frequently than any other wave except for Wave #1. Twice in May the ratio broke above the +15% line on May 8th and 15th. These May maximum efforts in the NYSE 52Wk Highs marked the high for the Dow Jones. After the Ratio peaked and declined in late May, the Dow Jones soon followed.
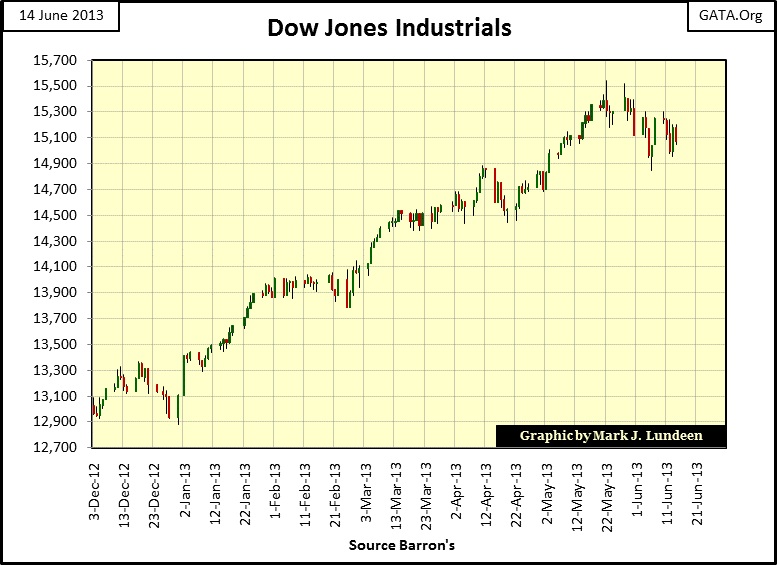
Well, after a five month 2600 point surge in the Dow Jones can we expect to see more of the same for the rest of the year? That would be doubtful. I personally believe this gain in the Dow Jones is totally contrived, a manifestation of Doctor Bernanke’s reckless monetary policy. It’s hard believing he would be as reckless as Alan Greenspan was from 08 October 1998 to 03 January 2000, where for 15 months the NASDAQ Composite index increased from 1419 to 4131; an increase of 190%! The NASDAQ bulls were foaming at the mouth after that “liquidity injection”, just before the bottom dropped in the high-tech bubble.
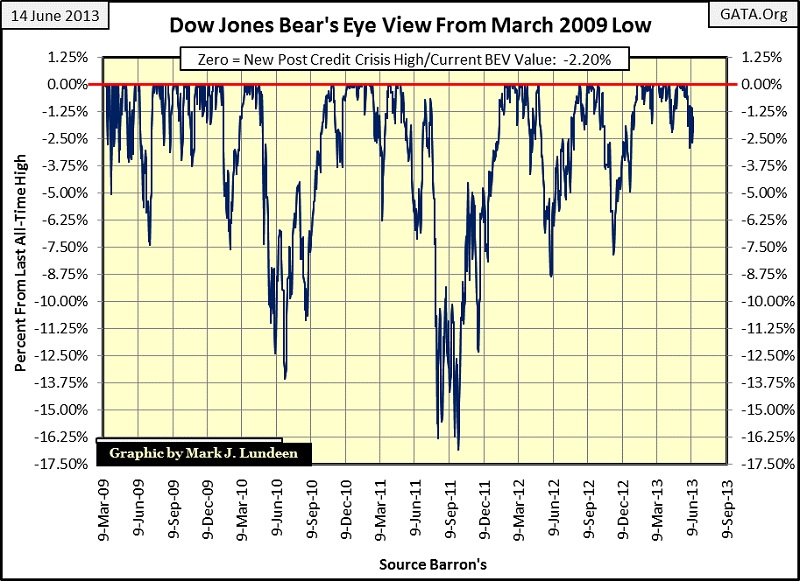
Doctor Bernanke doesn’t want that to happen on his watch; at least I don’t believe he does. So after proving that the stock market isn’t in danger of deflating, I expect the “policy makers” will allow the Dow Jones’ Bear’s Eye View plot below to trend towards its BEV -10% line for the rest of the summer.
But then what? Maybe the Dow Jones will recover and rise up to new all-time highs; and then maybe not. As I’ve said before; I don’t believe a resumption of the 2007-09 market crash a few years after the fact is an impossibility. The Credit Crisis crash was only reversed due to massive intervention by the global central banking system and their governments, with the US Federal government and its Federal Reserve doing much of the inflationary heavy lifting to get the financial markets to where they are today. This is a fact that has been admitted by many high officials and by members of the media for the past four years. I have a file full of quotes by these big shots saying they saved the world from Mr Bear in 2009. I don’t know about that, but they did get the financial markets going up again.
However, the market has big problems that current commentators are ignoring; for one thing the “economic data” published by the US government is as bogus as what the former Soviet Union used to publish, and we remember how that worked out for Mother Russia – not too good. Also, the Patriot Act passed during the Bush administration, a bipartisan bill, allows for what some have called the falsification of corporate accounting standards when “National Security” is an issue.
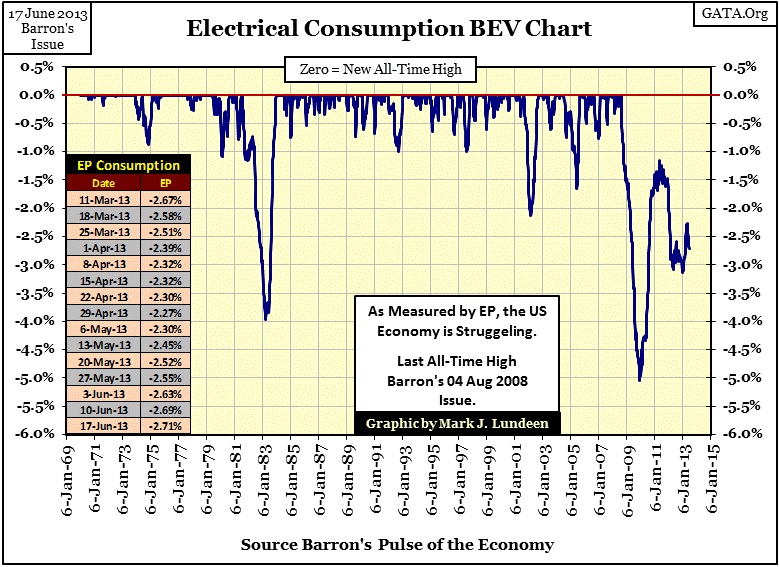
Well, people being people are the same if they live on Main Street or Wall Street, and people everywhere hate losing money when they do something stupid. But Wall Street can afford the best lawyers and lobbyists in Washington. So is the current ascension for the Dow Jones earnings due to increases in profitability, or to increasing risks in “national security?” I really don’t know, but looking at the American consumption of electrical power since August 2008, I can’t make the case for rising corporate earnings from an increase in profitability.
So, can we trust the quarterly reporting of corporate earnings, or government unemployment, CPI and GDP numbers? I don’t! One of these days reality is going to catch with the financial markets and that will be bad for the bulls.
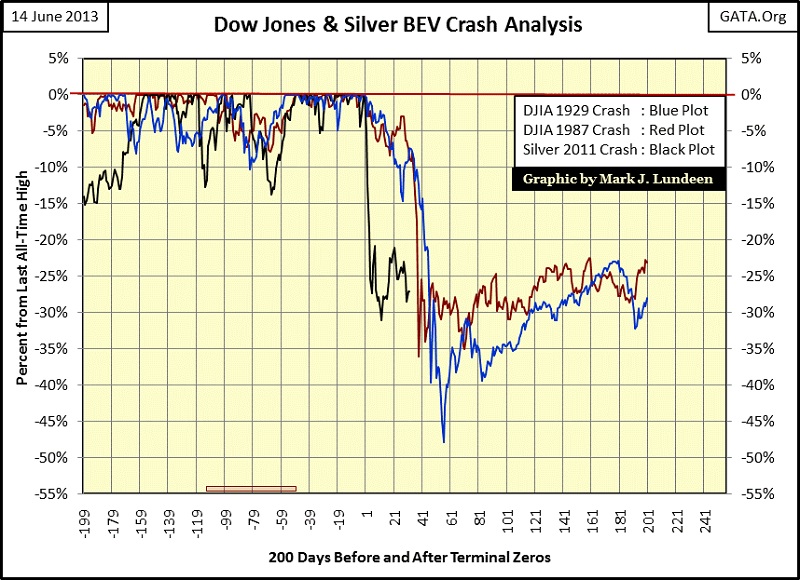
Okay, but will the last half of 2013 see the start of the next market crash? I don’t know, but I do know how the crash will start; exactly as it did in 1929 and 1987. The Dow Jones will see a new all-time high, and begin what market commentators will at first see as a correction that ultimately will turn into something completely different.
Below I’ve placed three well known crashes in the market: the Dow Jones for 1929 and 1987 as well as silver during April 2011. I’ve aligned all three BEV Plots so their Terminal Zeros (TZ: bull market’s last all-time high, or high of the move in silver’s case) on day Zero, plus provide data for 200 days before the TZ. For the Dow Jones (Blue and Red Plots) and silver (Black Plot), we see the last two months (day’s -59 to 0) are extremely strong with lots of BEV Zeros (new Dow Jones all-time highs, or highs of move for silver). For the Dow Jones’ Plots, after their TZs (day zero) the next forty or so trading days it appears as if the market is making a 10% correction, and then the bottom dropped from underneath the market. As the current TZ occurred on May 28th, if this pattern holds, we’ll see the Dow Jones’ bulls having big problems sometime after late July which includes October. But this is no prediction on my part as market confidence in Doctor Bernanke’s QE to Infinity is currently holding, but confidence can evaporate in a few days should something big, bad and ugly makes the news cycle.
But the day is coming when the current market attitude will sour, when the rest of the world catches up with the world view of silver investors, that the markets are currently manipulated to an unhealthy degree, and confidence is only backed by nonsense and BS numbers.
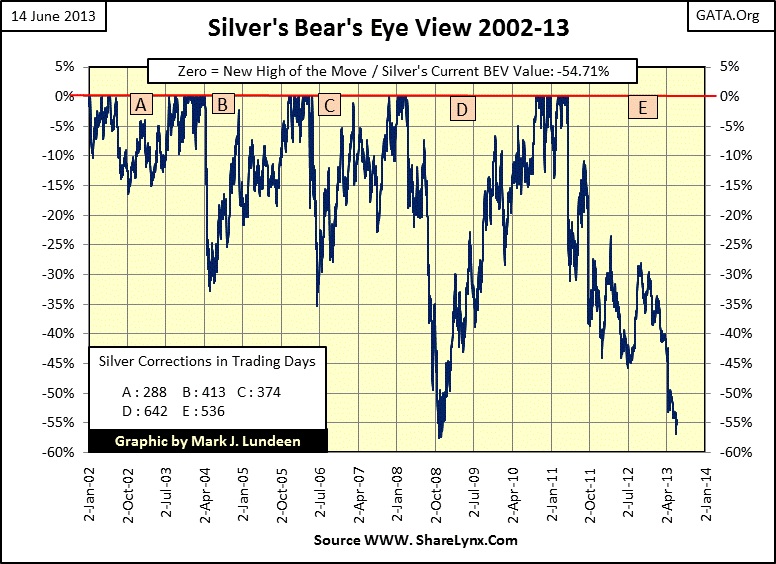
Look at silver’s black plot above. Two years ago on April 29, 2011 silver saw its current TZ, or high of the move of $48.58. This was just wisp below its last all-time high of January 1980. Then four trading days later silver sees an incredible 25% collapse coming from nowhere! How does something like that happen? The same way silver and gold collapsed on April 12 & 15 of this year; hundreds of tons of non-existent metal bombard the paper-silver futures market with no comment by government regulators, or the financial media for the most part. And the big declines in silver and gold since the beginning of their bull markets over ten years ago have all been the same; with a blizzard of paper promises to deliver metal from banks and hedge funds that don’t mine, process or consume silver or gold.
The current situation the silver and gold longs find themselves in with market regulators and the financial media reminds me of Conan Doyle’s Sherlock Holmes short story of “Silver Blaze”, the race horse who disappeared before the big race and the dog that didn’t bark:
Gregory (Scotland Yard detective): "Is there any other point to which you would wish to draw my attention?"
Holmes: "To the curious incident of the dog in the night-time."
Gregory: "The dog did nothing in the night-time."
Holmes: "That was the curious incident."
The dog didn’t bark as Silver Blaze’s owner did the dirty deed as his dog looked on in silence. The silver market’s government regulators aren’t barking because the government and our politically connected banking system are behind these amazing free falls in the price of silver and gold. One doesn’t need to be Sherlock Holmes to see that. But things are changing, things that one day will change the current situation in the silver market.
Here is the Bear’s Eye View (BEV) for the price of silver from the beginning of its current bull market to this week’s close. On Monday of this week (April 10), silver declined -56.97% from its TZ, its April 2011 high of the move. That placed silver’s current decline to within 1% of its October 2008 credit crisis decline of 57.51%. Ouch!
This massive decline in the price of silver, isn’t just hurting silver investors, but also the companies that mine silver, their employees and the communities that the mining industry supports. And this is also true for the industrial users of silver who will eventually be impacted by silver shortages as these horrific declines are playing havoc on future silver production. Unlike gold, silver is a strategic metal currently in shortage.
In silver’s BEV chart above we see the similarities between 2008 and 2013; their 56% decline in price. However, in the BEV chart below plotting silver’s open interest we see the differences. During silver’s credit crisis’ decline from March to October 2008 (the left shaded area), the price of silver not only declined over 57%, but its open interest collapsed by over 100,000 contracts. As each contract contains a short-side “promise” to deliver 5000 ounces of silver, we see a withdrawal of over 500 million ounces of promised silver from the COMEX market as the silver longs ran for their lives as the price of silver collapsed over 56%! The big Wall Street banks (the big shorts) made a fortune on their contrived collapse in the price of silver as the CFTC said nothing.
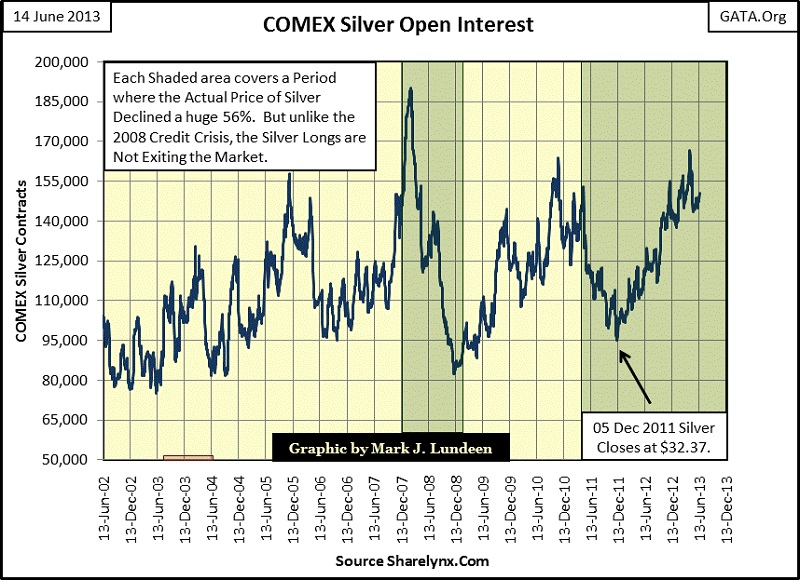
But as we see in the current 56% decline (right shaded box), things have changed. From April to December 2011, the price of silver fell from $48 to $32 on a decline of 40,000 contracts in silver’s open interest. The shorts on these 40,000 contracts could lock in their profits as the silver longs were willing to sell them their 40,000 contracts at a loss. Then something really strange happened; the price of silver continued declining after December 2011, but now on rising open interest. This prevented the large scale shorts from locking in their profits as the longs were apparently happy to carry any losses generated by the declining price of silver. After December 2011, if a big bank wanted to reduce their short side exposure to silver by say 10,000 contracts, they would have to find some other large institution to assume their short position, as the longs were unwilling to sell them their long positions at a loss.
For the longs on these contracts, since December 2011 they have taken horrible losses but they are still only paper losses. Obviously they and their brokers don’t seem to care. What kind of paper losses are we looking at? Using this data it’s impossible to answer that with precision, but a back of the envelope answer for current paper losses might look like this, and note that a $7.76 billion dollar paper loss for the longs is also a $7.76 billion dollar paper gain for the shorts.

Note: I used the entire open interest figure for June 14 instead of the net to calculate the profit and loss figure, so the paper profits for the shorts, and paper losses for the longs is listed as $7.76 billion dollars. But that is only a best guess on my part. No matter, as one would think the financial pain for the silver longs is so intense that they would be forced to close their losing positions; still they have hung on since December 2011. The silver longs MUST have very deep pockets or their brokers would have closed their positions long ago. So what gives?
Well clearly there is someone in the silver market that is intentionally taking the losing side of the trade and is not afraid of losing a few billion dollars. Why? This is just a theory, but the stubborn longs may be the Chinese. They have plenty of reason to be angry at the US Government for selling them trillions of dollars of US Treasury Debt, and the Federal Reserve who is inflating the US money supply, making the Chinese investment in US T-Debt increasingly worthless with the passage of time and Wall Street bankers, who since Alan Greenspan “saved the market” in the 1987 crash, have either screwed, or will screw everybody entering the financial markets.
The following quote by an official of the Chinese banking system was reported by CNBC and the financial media at the time. Remember, in February 2009 the market was crashing because the US Government and Wall Street’s fraudulent mortgage scheme had blown up in the “global community’s” face, which we can be sure included China.
“We hate you guys. Once you start issuing $1 trillion-$2 trillion [$1,000bn-$2,000bn] . . .we know the dollar is going to depreciate, so we hate you guys but there is nothing much we can do.”
- Luo Ping, a director-general at the China Banking Regulatory Commission , 11 February 2009
Four years later, it’s is obvious that Washington and Wall Street has moved on from their multi-trillion dollar mortgage market fiasco. But many billions of people around the globe were robbed by purchasing what Wall Street sold to them; fraudulent AAA rated mortgages. To date, the Obama-Justice Department has refused to prosecute any high level Wall Street banking officers, for the good reason that the sub-prime mortgage market was mainly a political invention of the Democratic party. President Obama during his “community organizer” days won a lawsuit forcing Citi Bank to make sub-prime mortgages for Chicago’s poor. No doubt Wall Street willingly went for the ride, but it was Washington’s “affordable housing” policy, and their creatures Fannie Mae and Freddie Mac that created the credit crisis of 2007-09.
You can be sure that there are still some people who haven’t forgotten, or forgiven those responsible for what was done to them, and they know who did it. In China’s case, there is something they can do about it, if they cared to extract their revenge on Wall Street in the COMEX silver market. Again in the table below, the profit and loss figure is based on the current open interest value, not the net, and again this model is only an estimate of what could be.
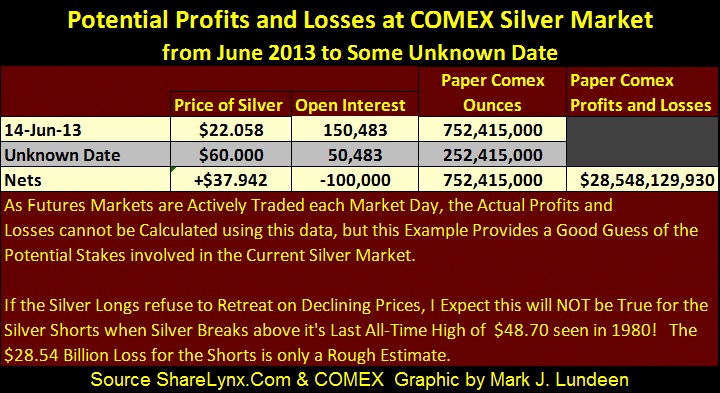
A paper loss of $28.54 billion may only be a fraction of the $85 billion dollars Federal Reserve is currently creating each and every month. But this $28.54 billion dollars would be charged directly against the big Wall Street banks’ financial position, particularly JP Morgan who is the biggest short in the COMEX silver market. As JP Morgan is also one of the companies included in the Dow Jones Industrials Average, their problem becomes a problem for the stock market.
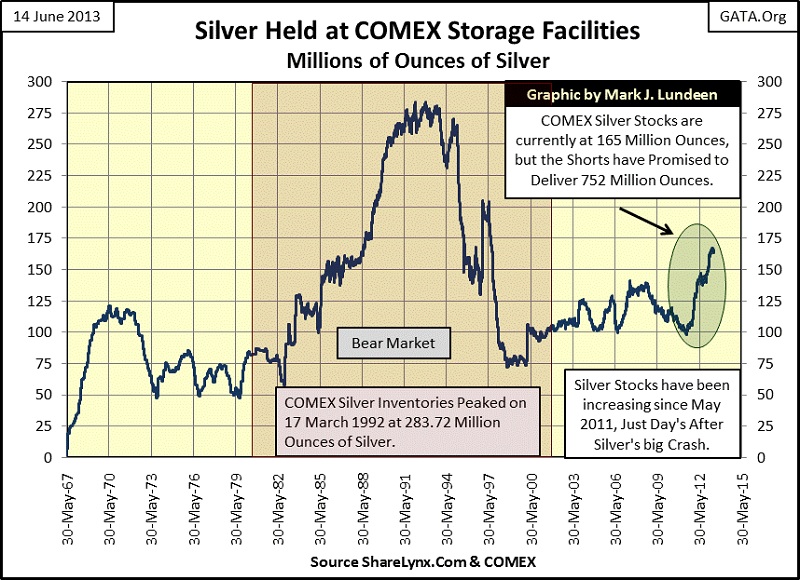
For reasons of “national security” current accounting standards may allow Wall Street to ignore this massive but unrealized loss. But everything changes should the longs demand specific performance, or the delivery of actual silver from their Wall Street counterparties. This is because for every ounce of silver the COMEX actually holds, the silver shorts have promised to deliver 4.55 ounces. As most contracts are settle in dollars, this is no problem. But China has made it clear that they have more dollars and US Treasury debt than they want. What China actually wants is gold and silver, and the COMEX currently contains 165 million ounces of silver that is theirs for the taking. All they have to do is go long, and stand for delivery.
Understand that a good portion of this silver currently held at the COMEX is not for sale, but belongs to people or fiduciaries who pay for “secure storage” of their metal. But after the MF Global debacle and Germany’s discovery that their gold held in New York isn’t exactly theirs any more, I wouldn’t be surprised if the COMEX didn’t give China all the silver they had with no fear of the law. Heck, seeing Wall Street giving other peoples stuff to favored third parties as a means to get out of a tight spot is becoming a regular habit. But if China asked for as much silver the shorts have promised to deliver (752 million ounces), but can’t possibly deliver as it doesn’t exist, that would be a big problem.
I remind my readers that this China connection to the COMEX is pure speculation on my part, an attempt to explain the abnormality of seeing open interest rise significantly for a year and a half on sharply declining prices. There could be plenty of other reasons this is happening, but then maybe not. One thing for sure, with time all will become known and I personally expect the current open interest situation in the silver market, should it continue, will prove to be historically profitable for the bulls with the patience to wait for its final resolution.
share
share
share
share
share
More from Silver Phoenix 500


