Market Turning Points
 share
share
 share
share
 share
share
 share
share
 share
share
Current position of the market
SPX: Long-term trend – In 1932 and 1974, the 40-yr cycle was responsible for protracted market weakness. The current phase is due this year but where is the weakness? Has man (Federal Reserve) finally achieved dominance over universal rhythms or has it simply delayed the inevitable?
Intermediate trend – We are looking for the move from 1905 to end, after which a much more serious correction should start.
Analysis of the short-term trend is done on a daily basis with the help of hourly charts. It is an important adjunct to the analysis of daily and weekly charts which discusses the course of longer market trends.
IS A CREDIBLE TOP FORMING?
Market Overview
The last newsletter warned that the market was getting a little disjointed and that the weak indices could start to affect the strong rather than the other way around. This is evidently what happened last week with the market as a whole weakening perceptibly. Not enough, however to give us a clear intermediate sell signal. We need just a little more proof that we are starting an important decline and next week should go a long way toward determining this. Let’s see where we stand at Friday’s close!
Momentum: Continued deterioration took place in the weekly and daily MACDs although it looks as if the daily histogram is trying to stabilize. This is also noticeable in the daily SRSI and A/D oscillator. However, this would have to lead to stabilization in the weekly indicators as well to give some reassurance to the bulls; but so far there is none.
Breadth: The McClellan Oscillator is also trying to stabilize, but it did make a new low on Thursday and, in spite of Friday’s rally, it remains very negative, which has caused the McClellan Summation Index to make a new low (since July of last year). This is what I mean by the fact that stabilization is not yet visible at the intermediate level. Au contraire!
VIX: Has been awakened by last week’s weakness and is now challenging the top of its corrective channel. We’ll need a clear break outside of it and a new short-term high to confirm the start of an intermediate downtrend in the market
Structure: Technical signs are beginning to suggest that primary wave III (which started in October 2011) has come to an end and that wave IV may finally be starting.
Accumulation/distribution: On the long-term SPX Point & Figure chart (3X) it looks as if the bull/bear battle for supremacy began in late July with the bears taking an early lead. However they failed to follow through and the bulls regained control sending the index to a slightly new high. The bears brought reinforcements and counter-attacked successfully in mid-September but had to give up a portion of their newly acquired real-estate at the end of the week.
Cycles: The long-awaited major Kress cycles may be starting to have an effect on the market. The Fed’s easy money program has either reduced their effectiveness to a mere face-saving decline three or four weeks in duration OR, it has simply delayed their lows by a few months. Since we do not know which it is, we should be prepared for both eventualities.
Chart Analysis
The daily SPX chart (courtesy of QCharts.com) shows that with last week’s action, the first important support level was breached. Note, however, that on Friday the index bounced back above it, somewhat neutralizing the break. The index found support at an internal parallel which just happened to coincide with a 50% retracement of the rally from 1905 to 1919. By the looks of things, Friday’s rally may not be over and this is going to encourage the EW analysts to look at the total decline simply as an a–b-c correction. But I would not be so quick to jump to that conclusion. The bulls will have to prove to me that they can recover the lost ground and attempt to make a new high.

To determine the market’s future direction should be really simple. If we continue to rally and the bulls fail to achieve a new high, then the onus will be on the bears to make a new low. Right now, they gained a slight advantage by breaking below the 1979 level, even with the rebound above. They must now restrain bulls from making a new high in order to keep it. 
The oscillators are beginning to firm up with the first hint of divergence appearing in the SRSI. The A/D oscillator failed to make a new low in Thursday’s decline (which is also positive divergence), and Friday’s rally produced a move above the downtrend line and above the former high formed by the 1999 top. This is short-term bullish! The MACD is now approaching the zero line but has not gone negative, which it must do to suggest that lower prices are ahead. This is why next week’s action will be important to analyze. It could determine the longer-term intention of the market.
The hourly chart (also courtesy of QChart.com) shows that SPX has rallied, met with resistance at the top of its corrective channel line, filled a short-term count for both Fib and P&F, and has entered a short consolidation. Since all the oscillators are still in an uptrend, it is likely that after a slight pause, the index could move to the next near-term projection. There are actually two, potentially! One lies just below the former near-term top of 1999, and the other just above. If we cannot go beyond the first one before resuming the decline, it will give more credibility to the view that we have started an important downtrend. Even if we go above, it will not necessarily mean that we are back in an uptrend. In both cases, we won’t really know what the market wants to do until it starts to correct after reaching one of these two targets. Again, this is what next week’s action should clarify.

Note that the A/D oscillator (bottom) is extremely overbought and it will take some time to get it back into a downtrend. This could allow the market to move a little higher before becoming vulnerable to another wave of selling.
Breadth
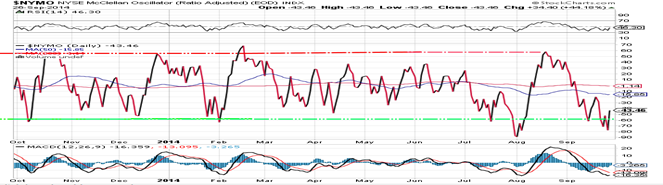
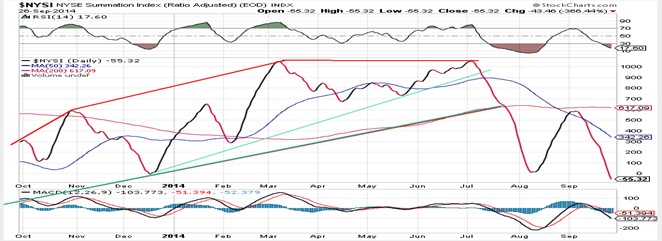
The McClellan Oscillator and the Summation Index appear below (courtesy of StockCharts.com).
The McClellan Oscillator presents pretty much the same picture as my daily A/D oscillator which was analyzed above. It is oversold, and started to rally on Friday overcoming the last short-term top. This should lead to an extension of the move.
But, by remaining negative for a prolonged period at the bottom of its range, the NYMO has done some severe damage to the Summation Index and has sent it from a mid-range positive position to a negative level which has surpassed the August low. That puts it ahead of the market which has only achieved a lower low followed by a lower high. The NYSI had taken the next step and followed with another low, which places it already, technically, in an intermediate downtrend. Especially since it has fallen to the lowest level since early September 2013 when SPX was still in the low 1600s!
Sentiment Indicators
The SentimenTrader (courtesy of same) long term indicator remains at 60 for the sixth consecutive week. The fact that it did not go higher when SPX traded at 2019 is not necessarily a sign that we did not make an intermediate top, but it does require that this be confirmed by future market action.
VIX (NYSE Volatility Index) - Leads and confirms market reversals.
For the past three months VIX has run counter to the market, establishing a shallow uptrend as the SPX kept making new highs. Recently, it has attempted to break out of a downtrend channel for the second time and again was stopped at its top. Next week could be spent consolidating its recent gains in preparation for another try which should result in a successful break out.

IWM (iShares Russell 2000) - Historically a market leader.

Since March, when it made its high, IWM has traded sideways in a broad range. Lately, after another rally attempt, it reversed well short of its double top and is now challenging the trend line of a channel which extends back to October 2011 as well as its early August low. If it successfully breaks below both, this should confirm that an intermediate correction is under way.
TLT (20+yr Treasury Bond Fund) – Normally runs contrary to the equities market.
TLT broke out of a steady uptrend channel which started back in January, but jumped right back into it. This action suggests that it may need some additional consolidation before attempting to move higher.

GLD (ETF for gold) – runs contrary to the dollar index
GLD is now in a solid extension of its major correction and appears to be heading straight down toward the next 25-wk cycle low in November.

UUP (dollar ETF)
UUP barely rested before moving through the top of its base channel in what appears to be a textbook wave 3 which started in July. If so, it could end wave 5 (of 3) shortly as it meets with resistance at former tops. While processing wave 4, it will give GLD a badly needed respite ahead of its final plunge into the November lows.

USO (US Oil Fund) (following chart courtesy of QCharts.com)
USO is arresting its short-term decline just north of its base trend line which extends to the market bottom of 2009. Whatever it does in this area, it’s probably only a matter of time before it breaks below that long-term trend line.

Summary
Over the past four or five weeks, SPX500 has been making strong topping noises which have, so far, fallen short of confirming that an important correction has started. It will have a chance next week to clarify its intentions, especially after the middle of the week.
********
FREE TRIAL SUBSCRIPTON
Market Turning Points is an uncommonly dependable, reasonably priced service providing intra-day market updates, a daily Market Summary, and detailed weekend reports. It is ideally suited to traders, but it can also be valuable to investors since highly accurate longer-term price projections are provided using Point & Figure analysis and Fibonacci projections. Best-time reversal estimates are obtained from cycle analysis. An increasing use of EWT for structural analysis and the recent addition of CIT (Change In Trend) time slots has greatly improved the exact timing of reversals.
For a FREE 4-week trial, send an email to: info@marketurningpoints.com
For further subscription options, payment plans, weekly newsletters, and for general information, I encourage you to visit my website at www.marketurningpoints.com. By clicking on “Free Newsletter” you can get a preview of the latest newsletter which is normally posted on Sunday afternoon (unless it happens to be a 3-day weekend in which case it could be posted on Monday).
The above comments and those made in the daily updates and the Market Summary about the financial markets are based purely on what I consider to be sound technical analysis principles. They represent my own opinion and are not meant to be construed as trading or investment advice, but are offered as an analytical point of view which might be of interest to those who follow stock market cycles and technical analysis.
share
share
share
share
share

When Andre Gratian was a stock broker years ago, a friend introduced him to technical analysis of the market. Consequently, it is not an exaggeration to say that Andre fell in love with this approach! Ever since then, it has become an increasingly important part of his professional life. Gratian has studied the works of Wyckoff, Edwards & Magee, Edward J. Dewey (cycles) and many others. However, one of my most profitable undertaking has probably been to study Point & Figure charting, which he finds invaluable in analyzing stocks and indices. If he were restricted to one methodology, this is the one that he would choose. This well-rounded background has given him what he feels to be a special insight into the stock market, facilitating the recognition of meaningful patterns and the ‘turning points’ in all trends, whether they be short or long term. Andre feels very comfortable discussing the stock market and passing on meaningful information to others. His subscribers include individuals and money managers throughout the world. Moreover, his Newsletters are currently published on several financial sites, here and abroad.
More from Silver Phoenix 500


