Maund on Gold & Silver

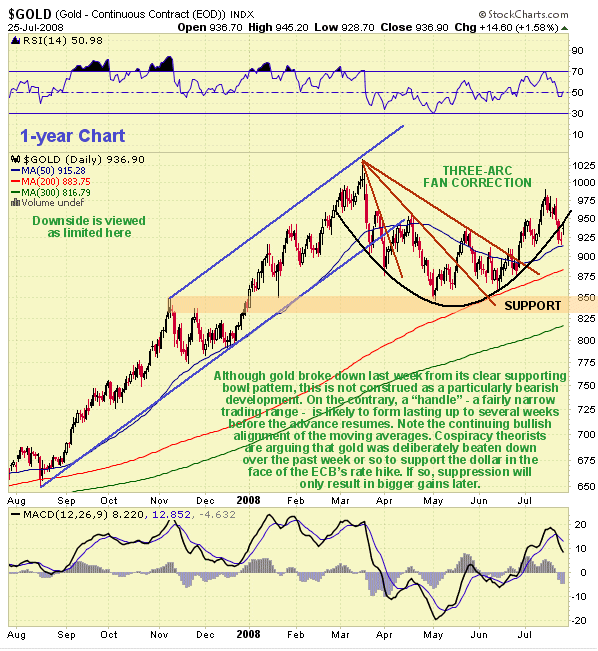
While the broad stockmarket has staged a relief rally from deeply oversold in response to the Fannie and Freddie bailout and oil has tumbled over the past week or two, both as predicted, gold has suffered more collateral damage than expected from these factors resulting in quite heavy losses in the Precious Metals sector. Conspiracy theorists are arguing that gold was deliberately targeted in order to help protect the dollar at a time when it is especially vulnerable due to the European Central Bank raising rates. Whatever the truth of this the magnitude of the decline in gold was not actually that great as we will shortly see when we examine the chart, while the danger to the dollar has certainly not been mitigated - on the contrary it has gotten worse.

On the 1-year chart we can see that gold last week broke down from the supporting bowl pattern that had recently propelled it to 3-month highs. At first sight this might be viewed as a bearish development, but what commonly happens with these cup and bowl patterns is that a "handle" forms after such a breakdown. This involves the price breaking down or sideways out of the bowl after first ascending higher at the right side of it - a development that can de disconcerting to inexperienced traders. What then typically happens is that the price tracks sideways for a while in a relatively narrow range forming a "handle" proportionate to the cup or bowl preceding it before the advance resumes. This is what we can now expect to occur with gold. All moving averages are in bullish alignment and downside is viewed as limited here. So gold is now expected to track sideways for between several weeks and perhaps up to 5 or 6 weeks between approximately the current price and the highs, before it breaks out to new highs.

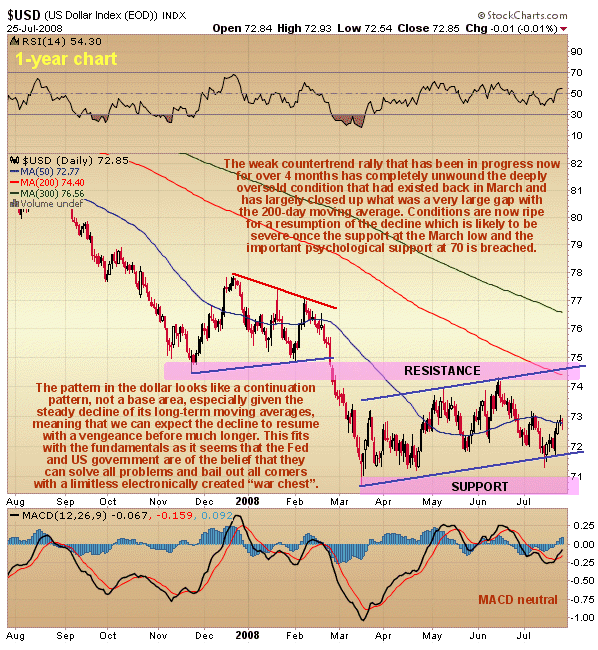
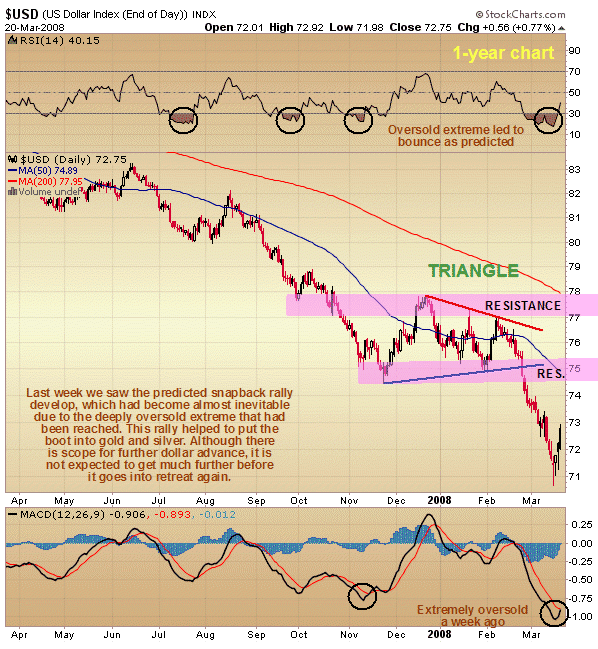
On the 1-year dollar chart we can that last week`s rally changes nothing. After looking like it was breaking down, the dollar snook back into the weak countertrend channel in force from mid-March and in so doing bought a little more time, but as we can see the steadily falling long-term moving averages drawing closer overhead look set to drive it lower before much longer. This fits with the fundamentals where the US Fed and the US government have made it clear with their recent actions in respect to Fannie and Freddie, and before that Bear Stearns via J P Morgan, that the largest hogs will be able to push their snouts squarely into the trough, so that their ears are flapping above their eyes, assured that the faucet will be kept wide open with a limitless supply of electronically created feed. In other words, if they are big enough to bring down the system down should they fail, they will be hooked up to the "taxpayer life-support system", socialist style, regardless of whether they end up nearly killing their hosts. This is what is meant by the term "too big to fail". What this must inevitably mean is a lot more dollars flying around, as if there aren't enough already, and alot more inflation, neither of which are renowned for causing the price of gold to fall.

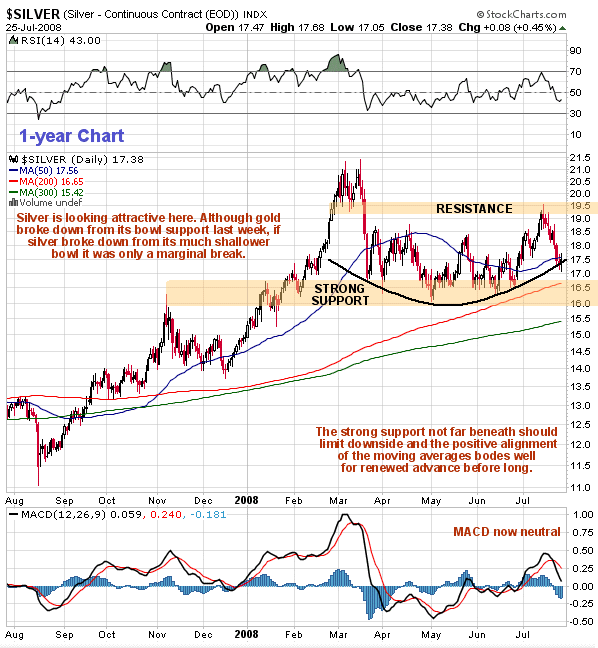
After looking set to challenge its highs silver turned abruptly lower and has fallen substantially over the past couple of weeks for the same reasons as gold, namely collateral damage resulting resulting from the rally in the broad stockmarket as crisis fears eased after the Fannie and Freddie bailout and the falling price of oil.
As usual, the arguments set out in the Gold Market update apply equally well to silver and we will here detail the differences. One significant difference is that the silver price had started to rise from a much shallower bowl pattern than that evident on the gold chart, and whereas gold broke down from its bowl pattern last week, if silver did the break was only marginal, as we can see on its 1-year chart. The main point to make about the silver chart is that it continues to look bullish, with strong underlying support and positively aligned moving averages.

In the Gold Market update it was pointed out that gold may mark out a "handle" to complete a "Bowl (cup) and Handle" pattern, a process that could take some weeks before gold is ready to challenge its highs, although it could happen alot sooner. If this is the case it clearly implies that silver will spend the same time rangebound between the resistance at $19.50 and the support at and not far below the current level before it is in position to challenge its highs. With a weaker dollar and continuing and possibly worsening inflation in prospect worldwide, the bullish case for Precious Metals remains unchanged and therefore silver is regarded as a buy at current levels and on any further short-term weakness, which is likely to be limited due to the strength of nearby support.
Clive Maund, Diploma Technical Analysis support@clivemaund.com www.clivemaund.com
Copiapo, Chile, 27 July 2008
No responsibility can be accepted for losses that may result as a consequence of trading on the basis of this analysis.


