More Fluctuations Along Record Highs, Which Direction Is Next?
 share
share
 share
share
 share
share
 share
share
 share
share
Briefly: In our opinion, speculative short positions are favored (with stop-loss at 2,330, and profit target at 2,150, S&P 500 index).
Our intraday outlook remains bearish, and our short-term outlook is bearish. Our medium-term outlook remains neutral, following S&P 500 index breakout above last year's all-time high:
Intraday outlook (next 24 hours): bearish
Short-term outlook (next 1-2 weeks): bearish
Medium-term outlook (next 1-3 months): neutral
Long-term outlook (next year): neutral
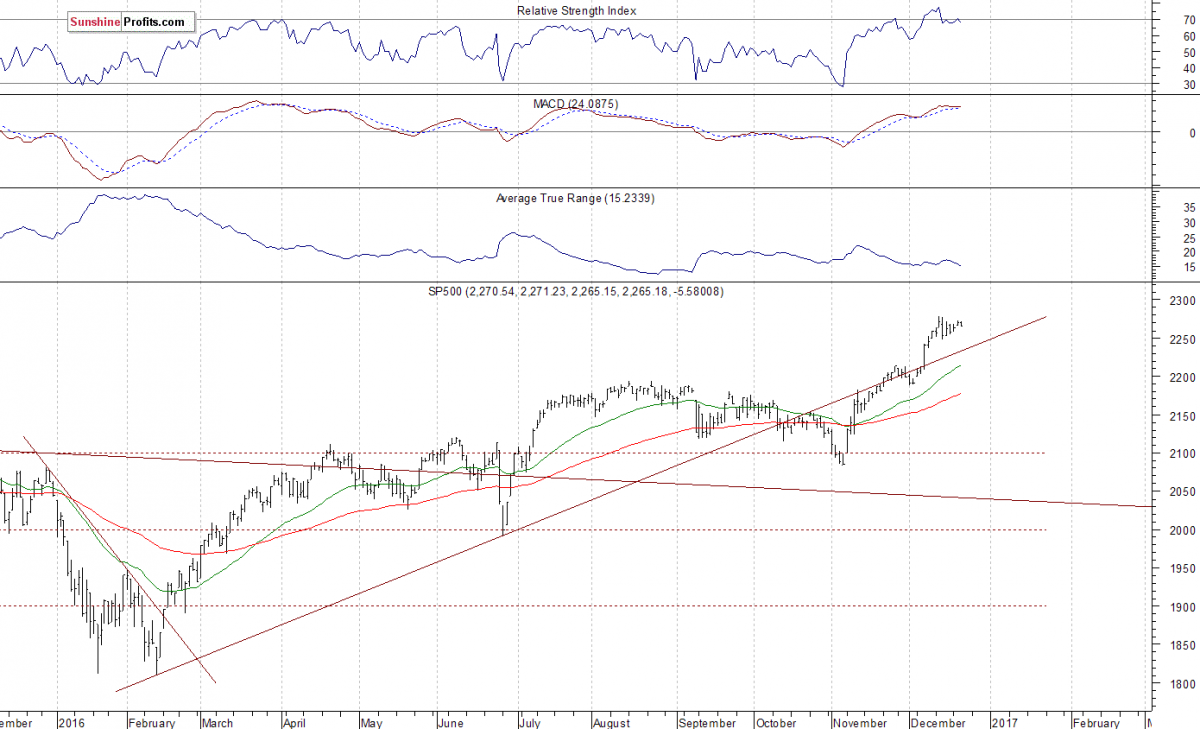
The main U.S. stock market indexes lost 0.1-0.3% on Wednesday, extending their short-term consolidation following recent rally, as investors reacted to some economic data announcements. The S&P 500 index remains relatively close to its record high of 2,277.53. The nearest important level of resistance is at around 2,275-2,280. The next resistance level is at 2,300 mark. On the other hand, support level is at 2,240-2,250, marked by previous level of resistance. The next important support level remains at 2,200-2,220. The market broke above its medium-term upward trend line recently, as we can see on the daily chart:
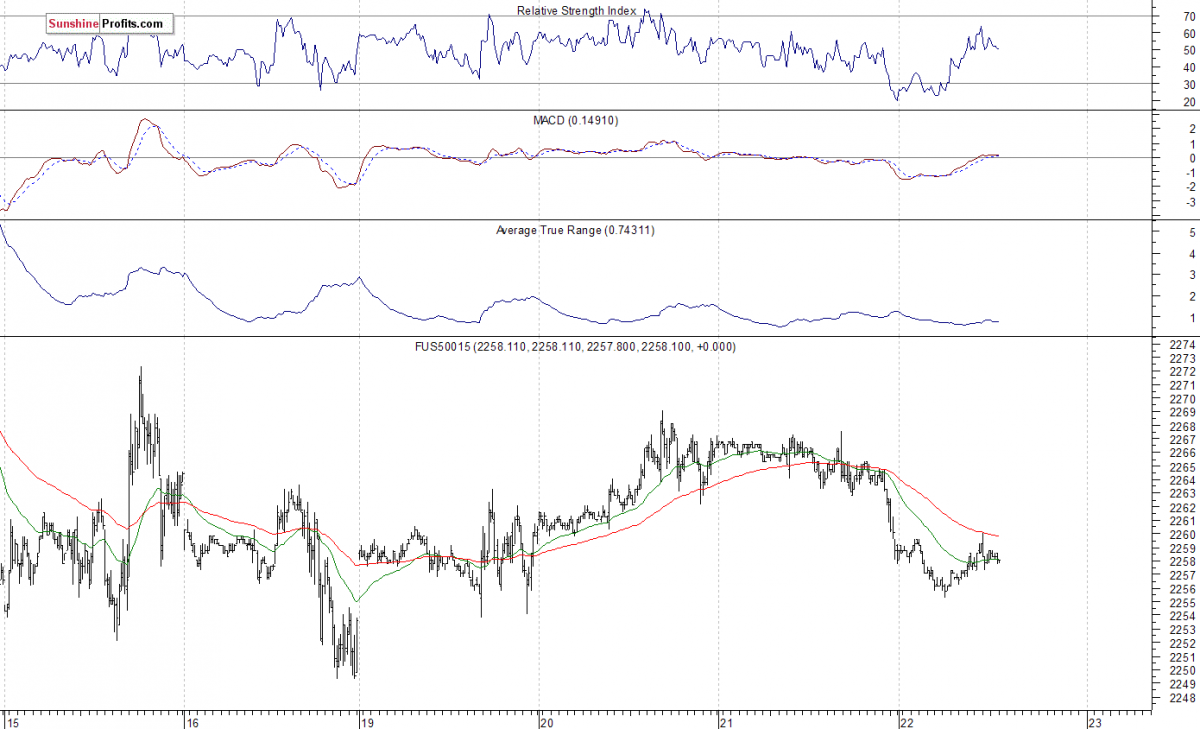
Expectations before the opening of today's trading session are virtually flat, with index futures currently down 0.1%. The European stock market indexes have been mixed so far. Investors will now wait for series of economic data announcements: GDP - Third Estimate, Initial Claims, Durable Orders at 8:30 a.m., FHFA Housing Price Index at 9:00 a.m., Leading Indicators, Personal Income, Personal Spending, Core PCE Price Index, Michigan Sentiment, New Home Sales at 10:00 a.m. The S&P 500 futures contract trades within an intraday consolidation following yesterday's move down. The nearest important level of support is at around 2,255, marked by short-term local low. On the other hand, resistance level is at 2,260-2,265:
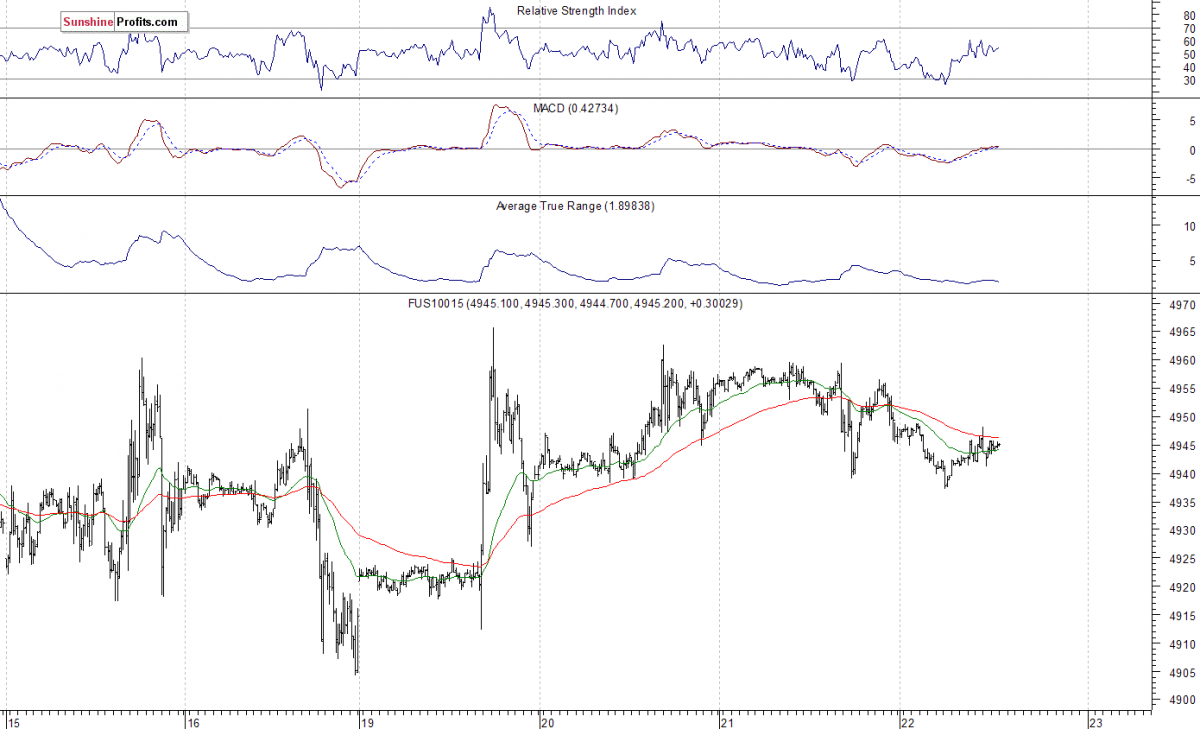
The technology Nasdaq 100 futures contract follows a similar path, as it currently trades within an intraday consolidation. The market remains close to 4,950 mark. The nearest important support level is at around 4,900-4,920, marked by previous level of resistance. On the other hand, resistance level is at 4,950-4,970, marked by record highs, as the 15-minute chart shows:
Concluding, the broad stock market remains relatively close to its all-time high, as the S&P 500 index continues to trade above 2,250 mark. However, we still can see medium-term overbought conditions. Therefore, we continue to maintain our speculative short position (opened on December 14 at 2,268.35 - opening price of the S&P 500 index). Stop-loss level is at 2,330 and potential profit target is at 2,150 (S&P 500 index). You can trade S&P 500 index using futures contracts (S&P 500 futures contract - SP, E-mini S&P 500 futures contract - ES) or an ETF like the SPDR S&P 500 ETF - SPY. It is always important to set some exit price level in case some events cause the price to move in the unlikely direction. Having safety measures in place helps limit potential losses while letting the gains grow.
To summarize: short position in S&P 500 index is justified from the risk/reward perspective with the following entry prices, stop-loss orders and profit target price levels:
S&P 500 index - short position: profit target level: 2,150; stop-loss level: 2,330
S&P 500 futures contract (March 2017) - short position: profit target level: 2,145; stop-loss level: 2,325
SPY ETF (SPDR S&P 500, not leveraged) - short position: profit target level: $214; stop-loss level: $232
SDS ETF (ProShares UltraShort S&P500, leveraged: -2x) - long position: profit target level: $16.35; stop-loss level: $14.00 (calculated using trade's opening price on Dec 14 at $14.78).
share
share
share
share
share
More from Silver Phoenix 500


