More Upside Following Tuesday's Fed Talk - Will It Continue Higher?
 share
share
 share
share
 share
share
 share
share
 share
share
Briefly: In our opinion, no speculative positions are justified.
Our intraday outlook is neutral, and our short-term outlook is neutral. Our medium-term outlook remains bearish, as the S&P 500 index extends its lower highs, lower lows sequence:
Intraday outlook (next 24 hours): neutral
Short-term outlook (next 1-2 weeks): neutral
Medium-term outlook (next 1-3 months): bearish
Long-term outlook (next year): neutral
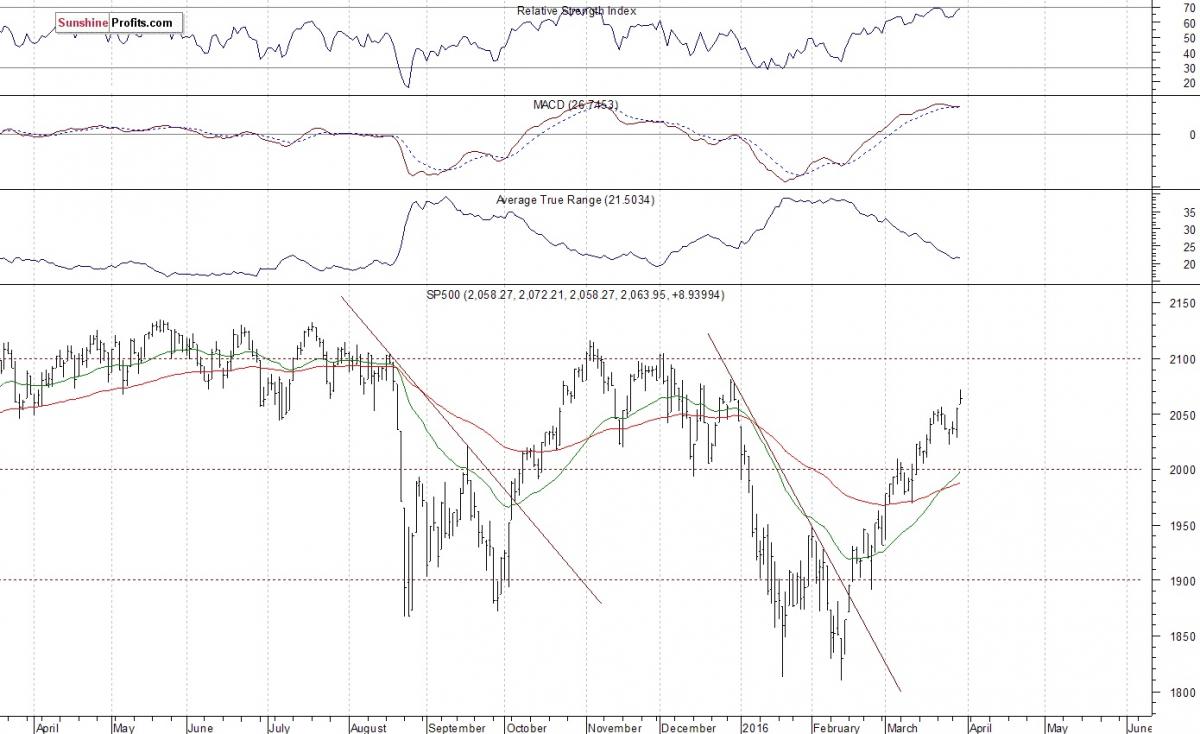
The U.S. stock market indexes gained 0.4-0.5% on Wednesday, extending their recent uptrend, as investors' sentiment remained bullish following Tuesday's Janet Yellen's speech, economic data releases. The S&P 500 index broke above its last week's local high of 2,056.60. It got closer to last year's November - December local highs along the level of 2,100. The nearest important level of resistance is at around 2,070-2,080, marked by the late December local high of 2,081.56. The next resistance level is at 2,100-2,120, marked by previous medium-term highs. On the other hand, the support level is at 2,055-2,060, marked by yesterday's daily gap up. The next support level remains at 2,000, marked by the previous level of resistance. There have been no confirmed negative signals so far. However, we can see some technical overbought conditions. The index continues to trade within a slightly descending medium-term trading channel, as the daily chart shows:
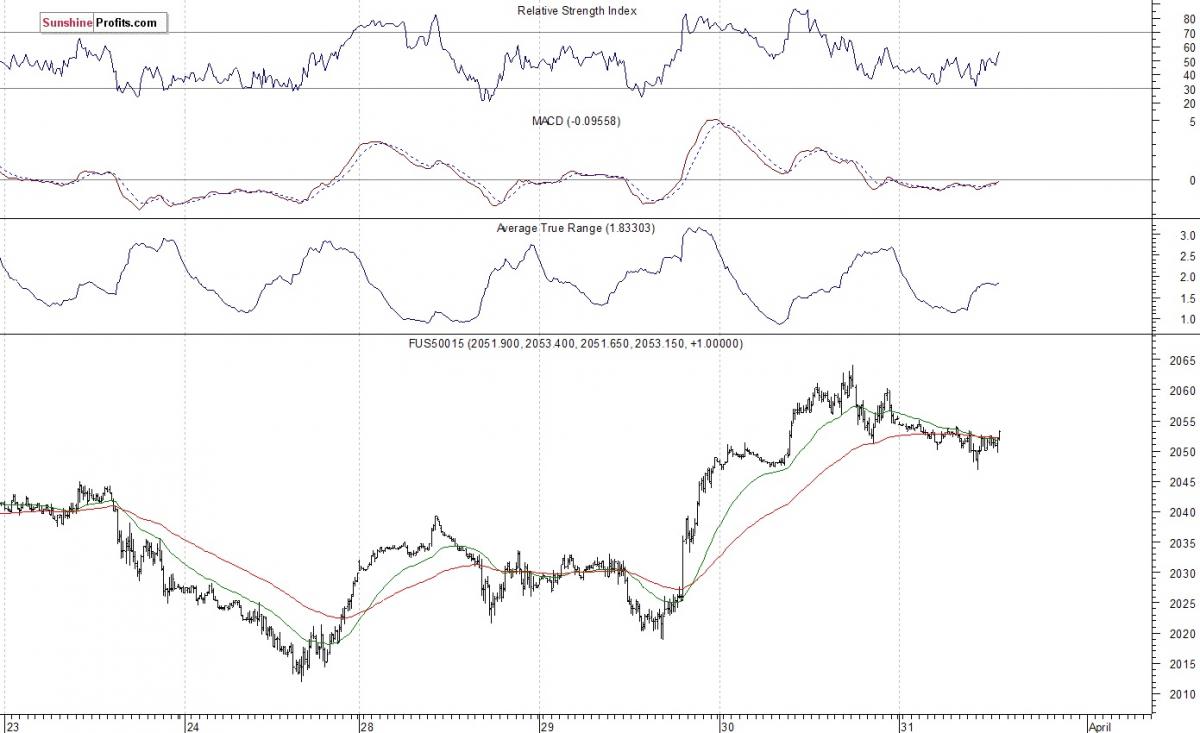
Expectations before the opening of today's trading session are slightly negative, with index futures currently down 0.2%. The European stock market indexes have lost 0.6-1.3% so far. Investors will now wait for some economic data announcements: Initial Claims at 8:30 a.m., Chicago PMI at 945 a.m. The S&P 500 futures contract trades within an intraday consolidation, following yesterday's move up. The nearest important level of resistance is at around 2,060-2,065, marked by local high. On the other hand, support level remains at 2,040-2,050, marked by the previous level of resistance, as we can see on the 15-minute chart:
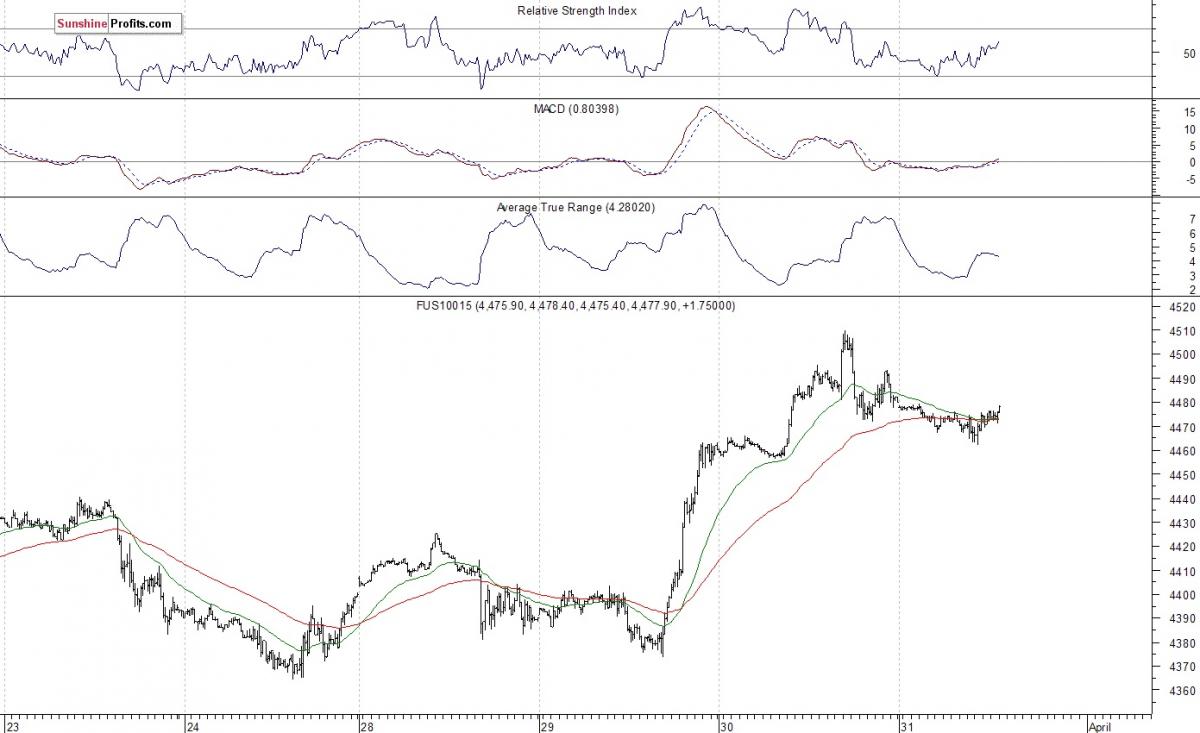
The technology Nasdaq 100 futures contract follows a similar path, as it currently trades within an intraday consolidation. The nearest important level of resistance is at around 4,500-4,510. On the other hand, the support level is at 4,450, among others. There have been no confirmed negative signals so far. However, we can see short-term overbought conditions:
Concluding, the broad stock market extended its short-term uptrend, as the S&P 500 index broke above its last week's high. The market is getting closer to its last year's medium-term highs. Will it break above the crucial long-term resistance level of 2,100-2,150 this time? Or is this just an upward move within a slightly descending medium-term trading channel? We can see some short-term technical overbought conditions. However, there have been no confirmed negative signals. We still prefer to be out of the market, avoiding low risk/reward ratio trades. We will let you know when we think it is safe to get back in the market.
********
Courtesy of SunshineProfits.com
share
share
share
share
share
More from Silver Phoenix 500


