Oil Trading Alert: Crude Oil - Technical Juncture
 share
share
 share
share
 share
share
 share
share
 share
share
Trading position (short-term; our opinion): No positions are justified from the risk/reward perspective.
 On Friday crude oil gained 1.24% as rig count declined to the lowest level ever. Thanks to this news, light crude hit a fresh March high, but will we see further rally in the coming week?
In our last Oil Trading Alert, we wrote the following:
(...) earlier today, the IEA, said that non-OPEC output would fall by 750,000 barrels per day (bpd) in 2016 compared to its previous estimate of 600,000 bpd. Additionally, U.S. production alone would decline by 530,000 bpd in 2016. Thanks to this news, crude oil futures extended gains in a pre-market trading, hitting a fresh high of $38.95, which suggests that the commodity could also move higher after the market's open and even approach the barrier of $40 later in the day (especially if today's Baker Hughes report would be bullish).
As it turned out, on Friday, crude oil extended gains and hit a fresh high of $39.02 after the Baker Hughes report showed that the total number of U.S. oil rigs dropped by 9 to 480 for the week ending on March 4, which was the lowest level in history (the previous lowest record came on April 23, 1999 when the rig count slipped to 488). On top of that, the number of active U.S. oil drilling rigs dropped by 6 to 386, which was the 12th consecutive week of weekly declines. Thanks to these numbers, light crude re-tested the major resistance levels, but will we see further rally in the coming week? Let's take a look at the charts and find out what can we infer from them (charts courtesy of http://stockcharts.com).
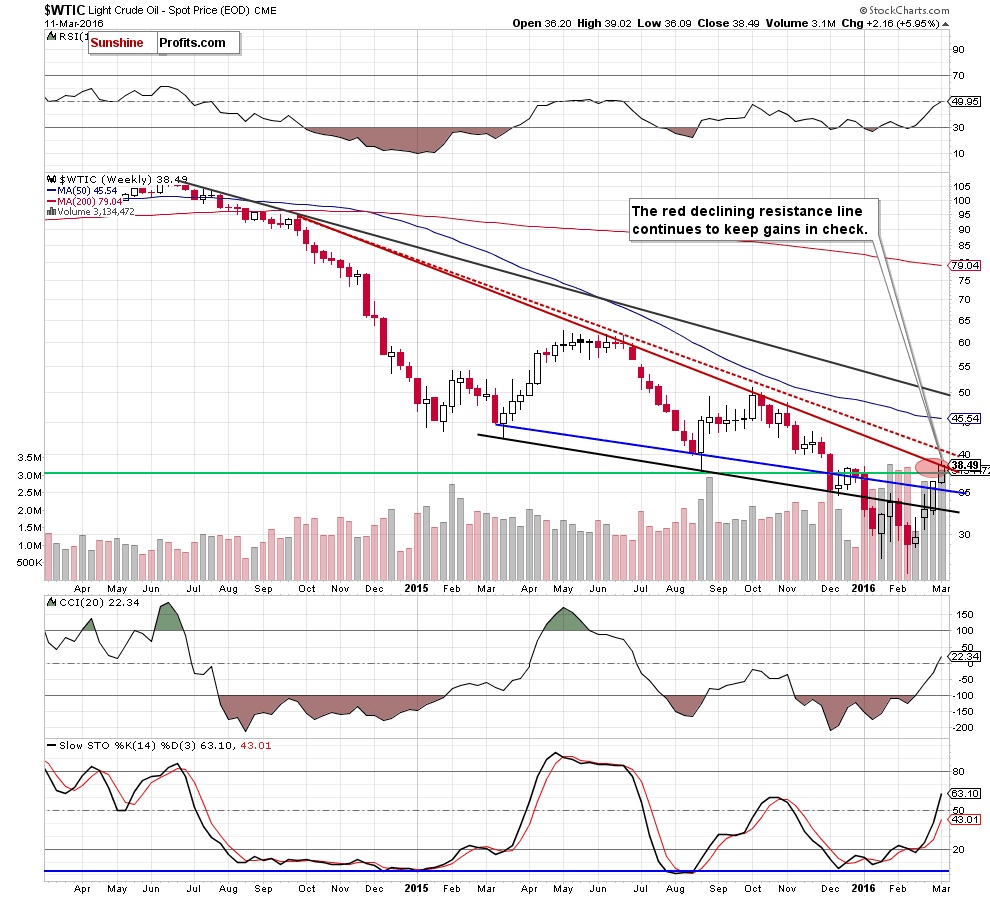
On the weekly chart, we see that although crude oil moved higher once again, the red declining resistance line (based on the Sep 29, Jun 22 and Oct 12 weekly closing prices) continues to keep gains in check.
Are there any other factors that could encourage oil bears to act? Let's examine the daily chart and find out.
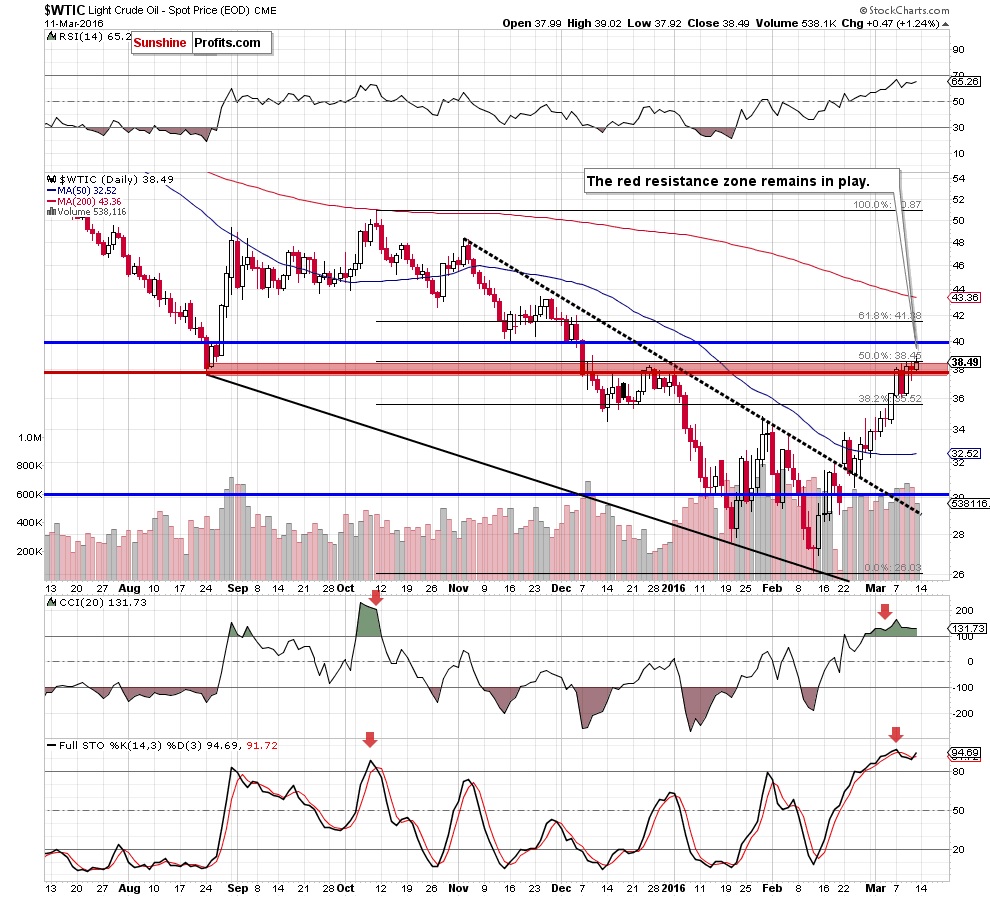
From this perspective, we see that crude oil moved higher once again, hitting a fresh March high. Despite this increase, the red resistance zone is still in play (there wasn't daily closure above it), which in combination with the medium-term picture and the proximity to the barrier of $40 could encourage oil bears to act and trigger a downward move from here in the coming days.
Additionally, we should keep in mind that the daily CCI and Stochastic Oscillator are overbought and there are also negative divergences between them and light crude. On top of that, when we take a closer look at the size of volume that accompanied Friday's increase we clearly see that it was quite small (compared to the volume that we saw last Monday or Wednesday), which suggests that the bulls may weaken.
Finishing today's alert, we'll take a look at the relationship between oil and gold once again.
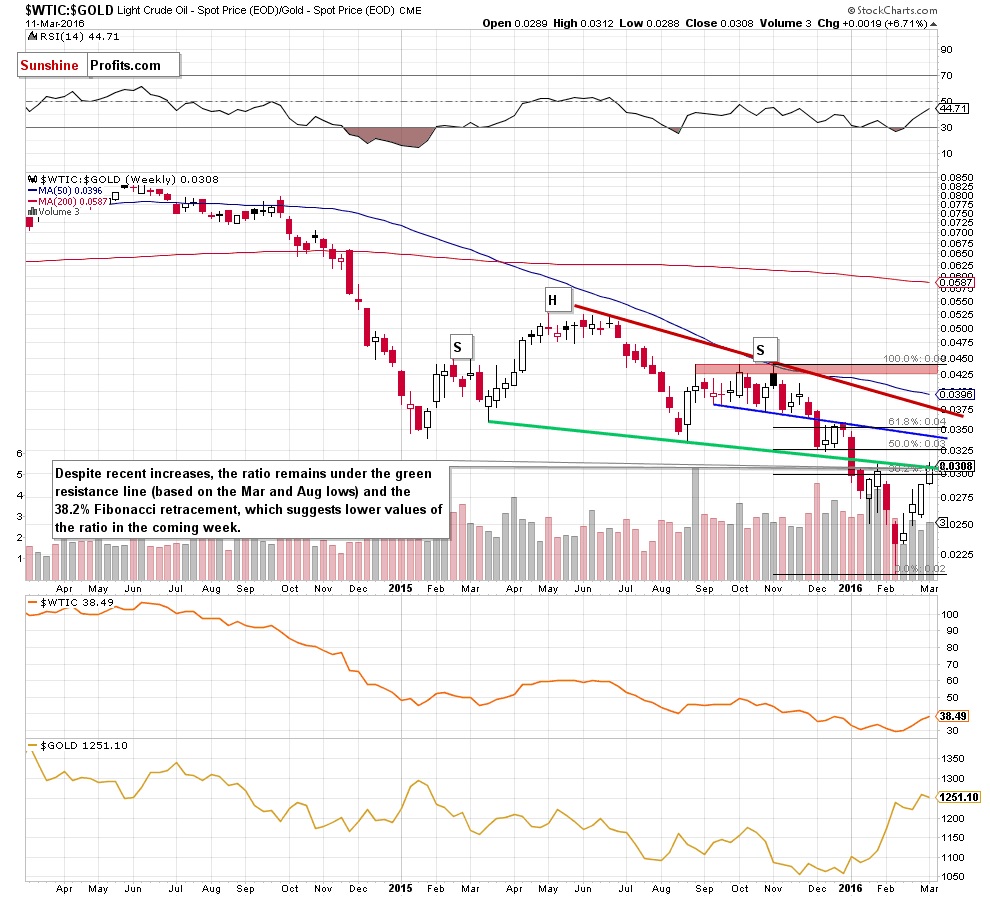
As you see on the weekly chart, although the oil-to-gold ratio moved higher once again, the green resistance line (based on the Mar and Aug lows) continues to keep gains in check, suggesting that reversal from here is very likely. Why? Because we saw a similar price action in late Jan. Back then the above-mentioned resistance triggered a sharp decline in the following weeks, which increases the probability that history will repeat itself once again and we'll see lower values of the ratio (and crude oil) in the coming week(s).
What about gold? Taking into account the fact that the recent increases in the ratio corresponded to the upward move in gold, it seems that reversal of the ratio will translate into lower values of the yellow metal. Nevertheless, if you would like to know more about gold as an investment, we encourage you to sign up for Gold & Silver Trading Alerts or the All-Inclusive Package that includes it.
Finishing today's alert, we would like to draw your attention to the current situation in crude oil futures, which moved sharply lower in a pre-market trading after Iranian Oil Minister's comments. Bijan Zanganeh said that his country won't join a production freeze deal until Iran increases its output to 4 million barrels a day (bpd). Taking this fact into account, it seems that crude oil will also erase some of recent gains later in the day. If we see such price action, the first downside target would be around $37.21, where the Mar 10 low is.
Summing up, the red resistance zone (marked on the daily chart) and the red resistance line (seen on the weekly chart) continues to keep gains in check (in terms of daily and weekly closing prices). Additionally, the current position of the indicators and the proximity to the psychologically important barrier of $40 suggests that reversal and lower values of the commodity are just around the corner.
Very short-term outlook: mixed with bearish bias
Short-term outlook: mixed with bearish bias
MT outlook: mixed
LT outlook: mixed
Trading position (short-term; our opinion): No positions are justified from the risk/reward perspective.
********
Courtesy of http://www.sunshineprofits.com/
share
share
share
share
share
More from Silver Phoenix 500


