Rate Hike Ahead? Here’s How To Get Your Portfolio Ready
 share
share
 share
share
 share
share
 share
share
 share
share
 Many experts and analysts believe a June rate hike seems very unlikely, but last Friday, Federal Reserve Chairwoman Janet Yellen hinted that one might happen as soon as the end of this year:
“If the economy continues to improve as I expect, I think it will be appropriate at some point this year to take the initial step to raise the federal funds rate target and begin the process of normalizing monetary policy.”
In light of this possibility, the question on investors’ minds should be: “How should I prep my portfolio?”
To answer that, we first need to discuss core investing.
The definition of a core holding changes slightly depending on a person’s investment goals, but generally speaking, it’s a fund or other type of security that represents the principal foundation of a portfolio, one that requires little, if any, adjustments over the long-term. In other words, it behaves pretty predictably in a variety of economic climates.
 Such securities tend to be conservative and a little “boring.” Think of them as a plain ham sandwich: What it lacks in flavor, it makes up for in keeping you going during the day. Savvy investors take full advantage of core holdings because they’ve historically provided stability and peace of mind. Examples might include large-cap, dividend-paying value stocks or short-term municipal bonds.
Regular readers of Investor Alert and Frank Talk have no doubt already seen a version of the following chart, but it’s worth sharing again to illustrate the importance of having a reliable core holding. Whereas the S&P 500 Index twice fell 40 percent last decade, our Near-Term Tax Free Fund (NEARX) remained stable and ticked higher. Had you invested $100,000 in both an S&P 500 fund and NEARX in December 2000, it would have taken roughly 14 years for the equity fund’s growth to catch up with and exceed that of NEARX.
An investment in S&P500 stocks has its place in most portfolios, of course, but think of NEARX as the stabilizer in times of extreme gains and losses such as we saw between 2000 and 2009.

It’s important to keep in mind, though, that the last decade was unique. We saw some serious market-rattling events—the dotcom bubble, 9/11 and the worst economic crisis since the Great Depression.
There will also be times when the equities market greatly outperforms the muni market. Take now, for instance. We’re in year six of one of the most durable bull runs in U.S. history.
This is what makes NEARX such an attractive core investment. Compared to the equities market, it displayed nowhere near the same amount of volatility in either good times or bad. It continued to climb and deliver positive returns, regardless of what the equities market was doing.
The Short End of the Curve
Last week the Bureau of Labor Statistics reported that the consumer price index (CPI), less food and energy, rose 0.3 percent in April. This, along with an improved jobs market, is exactly what the Fed was seeking to justify raising rates.
Investors need to be aware that interest rates and bond prices have an inverse relationship. When one rises, the other falls, and vice versa.

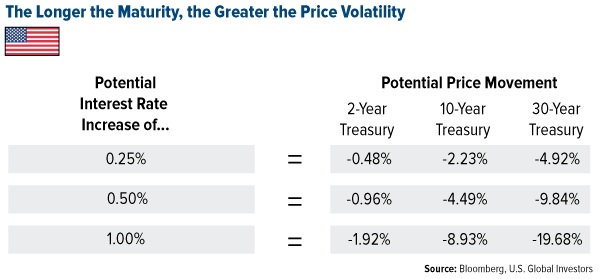
But that’s only part of the story. The longer a bond’s maturity, the greater its interest rate sensitivity; put another way, bonds that are more sensitive to changes in the interest rate environment will have greater price fluctuations than those with less sensitivity.
This means that in these times of uncertainty over when rates will rise, prudent investors should consider positioning their portfolios to focus on shorter average maturities, which have demonstrated less volatility than bonds with longer average maturities.
As you can see below in the hypothetical example using a two-year, 10-year and 30-year Treasury, the further out the maturity date and higher the rate hike, the more your security would be affected. Again, these are Treasuries, not municipal bonds, but munis could be similarly affected.
NEARX holds four stars overall from Morningstar, among 179 Municipal National Short-Term funds as of 3/31/2015, based on risk-adjusted return.
It’s also delivered over 20 years of positive returns.
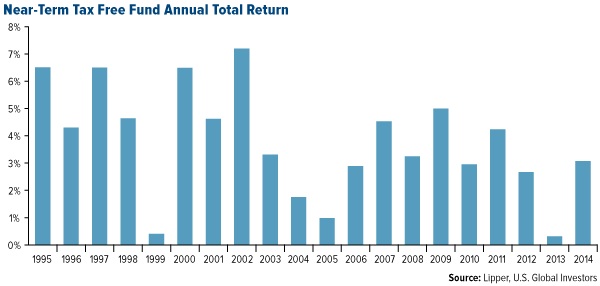
This is a rare achievement indeed.
So rare, in fact, that out of 25,000 equity and bond funds, only 30 have accomplished the same feat of delivering positive returns for 20 straight years, according to Lipper. As such, NEARX enjoys one of the most envied track records among its peers.
|
Explore our Near-Term Tax Free Fund investment cases! |
|
|
|
Can You Handle the Stress of Losing 40 Percent in the Market? “Robert describes his fail proof plan to place $100,000 in an S&P 500 Index fund. The 1990s was a gangbusters decade, after all, and he sees no reason to believe that the upcoming decade will be any different.”
|
|
|
A Little Pillow Talk Turned Her Husband On to Bonds “Karen hadn’t disregarded her husband’s foolproof plan for their money; in fact she acknowledged the impressive performance the S&P had been delivering. Investing would surely earn them more than their savings account would. But she was fearful of going ‘all in.’” |

********
Please consider carefully a fund’s investment objectives, risks, charges and expenses. For this and other important information, obtain a fund prospectus by visiting www.usfunds.com or by calling 1-800-US-FUNDS (1-800-873-8637). Read it carefully before investing. Distributed by U.S. Global Brokerage, Inc.
Past performance does not guarantee future results.
Total Annualized Returns as of 3/31/2015:
|
Fund |
One-Year |
Five-Year |
Ten-Year |
Gross Expense Ratio |
Expense Cap |
|
Near-Term Tax Free Fund |
2.38% |
2.59% |
3.10% |
1.08% |
0.45% |
|
S&P 500 Index |
12.73% |
14.47% |
8.01% |
N/A |
N/A |
Expense ratio as stated in the most recent prospectus. The expense cap is a contractual limit through April 30, 2016, for the Near-Term Tax Free Fund, on total fund operating expenses (exclusive of acquired fund fees and expenses, extraordinary expenses, taxes, brokerage commissions and interest).Performance data quoted above is historical. Past performance is no guarantee of future results. Results reflect the reinvestment of dividends and other earnings. For a portion of periods, the fund had expense limitations, without which returns would have been lower. Current performance may be higher or lower than the performance data quoted. The principal value and investment return of an investment will fluctuate so that your shares, when redeemed, may be worth more or less than their original cost. Performance does not include the effect of any direct fees described in the fund’s prospectus which, if applicable, would lower your total returns. Performance quoted for periods of one year or less is cumulative and not annualized. Obtain performance data current to the most recent month-end at www.usfunds.com or 1-800-US-FUNDS.
orningstar ratings based on risk-adjusted return and number of funds
Category: Municipal National Short-term funds
Through: 3/31/2015
Morningstar Ratings are based on risk-adjusted return. The Morningstar Rating for a fund is derived from a weighted-average of the performance figures associated with its three-, five- and ten-year Morningstar Rating metrics. Past performance does not guarantee future results. For each fund with at least a three-year history, Morningstar calculates a Morningstar Rating based on a Morningstar Risk-Adjusted Return measure that accounts for variation in a fund’s monthly performance (including the effects of sales charges, loads, and redemption fees), placing more emphasis on downward variations and rewarding consistent performance. The top 10% of funds in each category receive 5 stars, the next 22.5% receive 4 stars, the next 35% receive 3 stars, the next 22.5% receive 2 stars and the bottom 10% receive 1 star. (Each share class is counted as a fraction of one fund within this scale and rated separately, which may cause slight variations in the distribution percentages.)
Bond funds are subject to interest-rate risk; their value declines as interest rates rise. Though the Near-Term Tax Free Fund seeks minimal fluctuations in share price, it is subject to the risk that the credit quality of a portfolio holding could decline, as well as risk related to changes in the economic conditions of a state, region or issuer. These risks could cause the fund’s share price to decline. Tax-exempt income is federal income tax free. A portion of this income may be subject to state and local taxes and at times the alternative minimum tax. The Near-Term Tax Free Fund may invest up to 20% of its assets in securities that pay taxable interest. Income or fund distributions attributable to capital gains are usually subject to both state and federal income taxes.
The S&P 500 Stock Index is a widely recognized capitalization-weighted index of 500 common stock prices in U.S. companies.
The Consumer Price Index (CPI) is one of the most widely recognized price measures for tracking the price of a market basket of goods and services purchased by individuals. The weights of components are based on consumer spending patterns.
All opinions expressed and data provided are subject to change without notice. Some of these opinions may not be appropriate to every investor.
share
share
share
share
share
 Frank Holmes is the CEO and Chief Investment Officer of U.S. Global Investors. Mr. Holmes purchased a controlling interest in U.S. Global Investors in 1989 and became the firm’s chief investment officer in 1999. Under his guidance, the company’s funds have received numerous awards and honors including more than two dozen Lipper Fund Awards and certificates. In 2006, Mr. Holmes was selected mining fund manager of the year by the Mining Journal. He is also the co-author of “The Goldwatcher: Demystifying Gold Investing.” Mr. Holmes is engaged in a number of international philanthropies. He is a member of the President’s Circle and on the investment committee of the International Crisis Group, which works to resolve conflict around the world. He is also an advisor to the William J. Clinton Foundation on sustainable development in countries with resource-based economies. Mr. Holmes is a native of Toronto and is a graduate of the University of Western Ontario with a bachelor’s degree in economics. He is a former president and chairman of the Toronto Society of the Investment Dealers Association. Mr. Holmes is a much-sought-after keynote speaker at national and international investment conferences. He is also a regular commentator on the financial television networks CNBC, Bloomberg and Fox Business, and has been profiled by Fortune, Barron’s, The Financial Times and other publications. Visit the U.S. Global Investors website at http://www.usfunds.com.
More from Silver Phoenix 500


