Silver Bowl Breaks Down
 share
share
 share
share
 share
share
 share
share
 share
share
In our last silver update dated Sept. 16, entitled "A silver sling-shot set-up," we wrote that December Silver futures would have the chance to "sling-shot" to as high as $4.80 based on the parabolic bowl pattern in the daily chart at that time. At that time silver futures were trading just below $4.60 and we saw immediate underlying support based on the bowl as well as the chance to make up to the $4.80 "equilibrium" area of the past 8-month trading range. Silver futures made it as high as $4.73 (intraday) before falling under the weight of the 8-week downtrend line, eventually breaking the rim of the bowl. Note the trendline and broken bowl in the chart of daily December silver below.
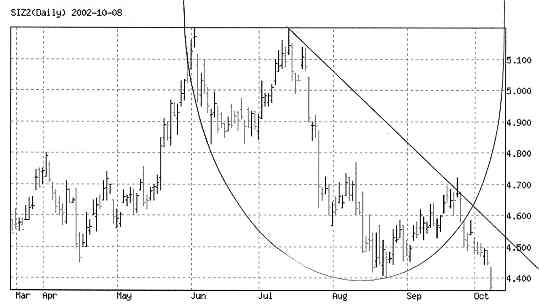
From this graph we can grasp not only silver's critical near-term parameters and potential support and resistance levels, but we also get a good view of what the current supply/demand balance looks like. There are some things of technical significance worth noting in this chart. The first is the height of the rally off the August lows of $4.40 to the highs of around $4.70 in September. This is approximately a $0.30 move. Using one of the rules of parabolic analysis we can arrive at a minimum downside objective for the silver decline by subtracting $0.30 from the point at which the parabolic bowl was broken, at about $4.58. This gives us a downside objective of $4.28-$4.30. We wrote in our last silver commentary, "breaking below $4.52 and then $4.47 would eliminate the bullish potential of this chart pattern set-up and would pave the way for a test of this year's lows and possibly to lower lows." Unfortunately, this is exactly what happened as silver violated $4.47 on a closing basis this week and now looks to be headed to test the area between $4.20-$4.30; in other words, a test of the 2001 lows is becoming a distinct possibility. To gain added perspective, let's pull up a graph of silver's 3-year weekly price performance. Note the features of the chart below.
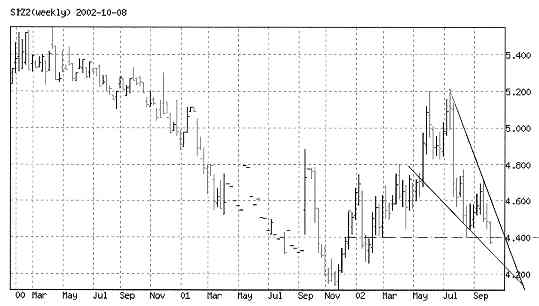
This chart shows silver has downside potential to as low as $4.20 based on the measuring implications of its previous swing. Taking liberties with this chart, however, and using the Predicted Trendline technique, we've drawn this falling wedge in the weekly chart which, even if drawn with parameters that are remotely correct, shows a predicted bottom sometime in November and a price low of no lower than $4.20 on a closing basis. A breakout from a falling wedge would be constructive of a recovery rally in early 2003.
share
share
share
share
share
More from Silver Phoenix 500


