Silver COT Update
 share
share
 share
share
 share
share
 share
share
 share
share
Let’s start with the overall NET POSITIONS chart:
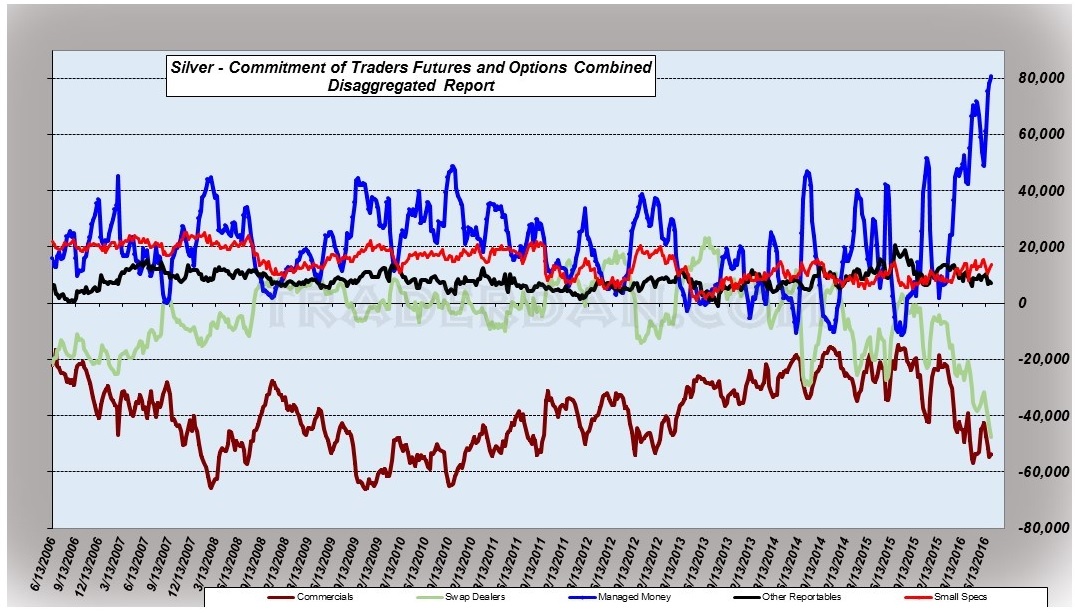
As you can see the Battle Royale between the titans of the Silver pit, aka, the Hedge funds versus the Swap Dealers and Commercials) continues unabated.
Once again another new all-time record high for the hedge funds against a new all-time record high for the Swap Dealers in their Net Short positions. Commercials remain well off their peak net short position scored some seven years ago.
Here’s a look at the OUTRIGHT POSITIONS for the hedgies:
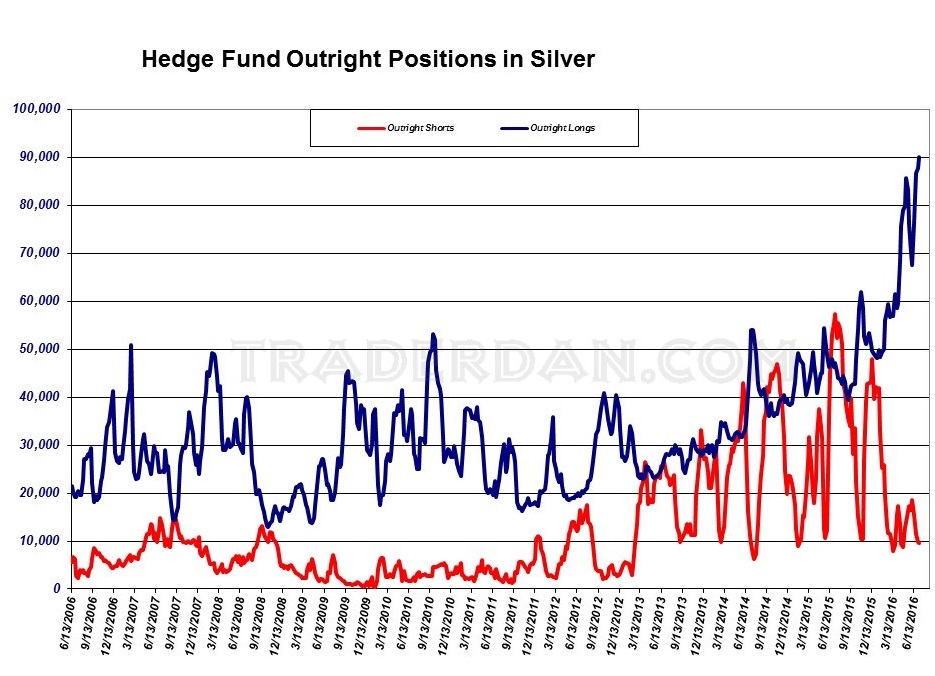
Mind boggling, isn’t it? There are over 90,000 long positions held by the hedge funds against a rather meager 10,000. That makes them long by a 9:1 ratio. If that is not lopsided, I do not know what is.
Here is the same data presented as a percentage of the total open interest. I am only charting the LONG positions.
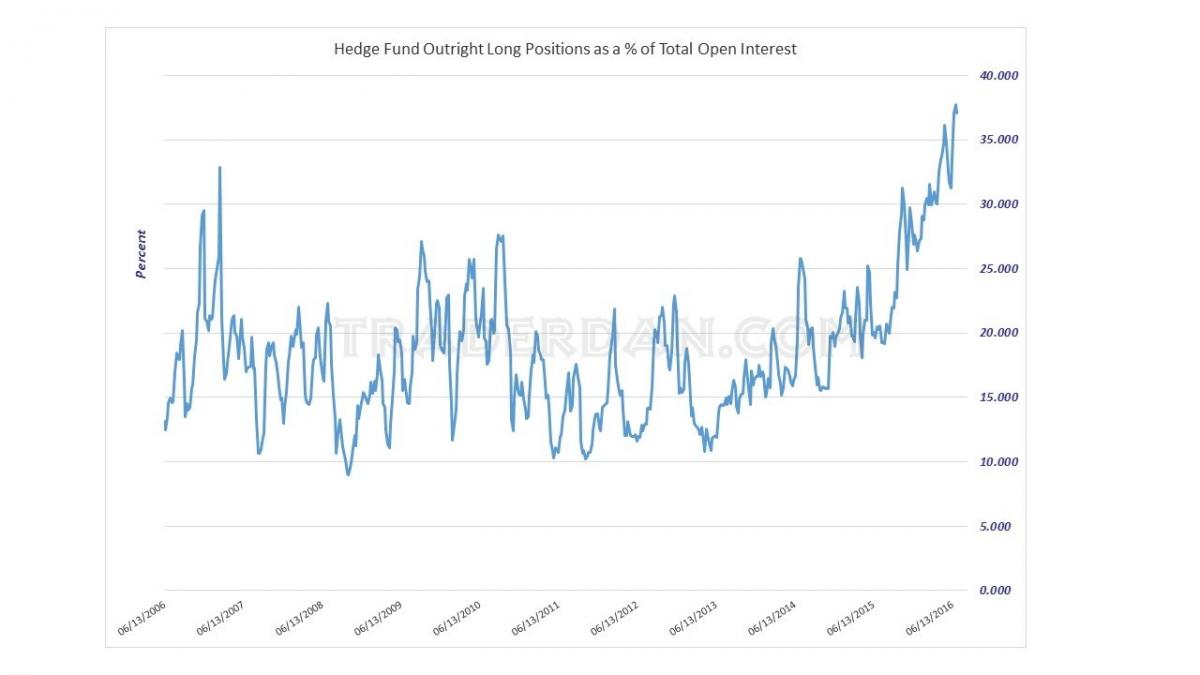
It remains up near that record territory.
What are the big boyz on the other side doing?
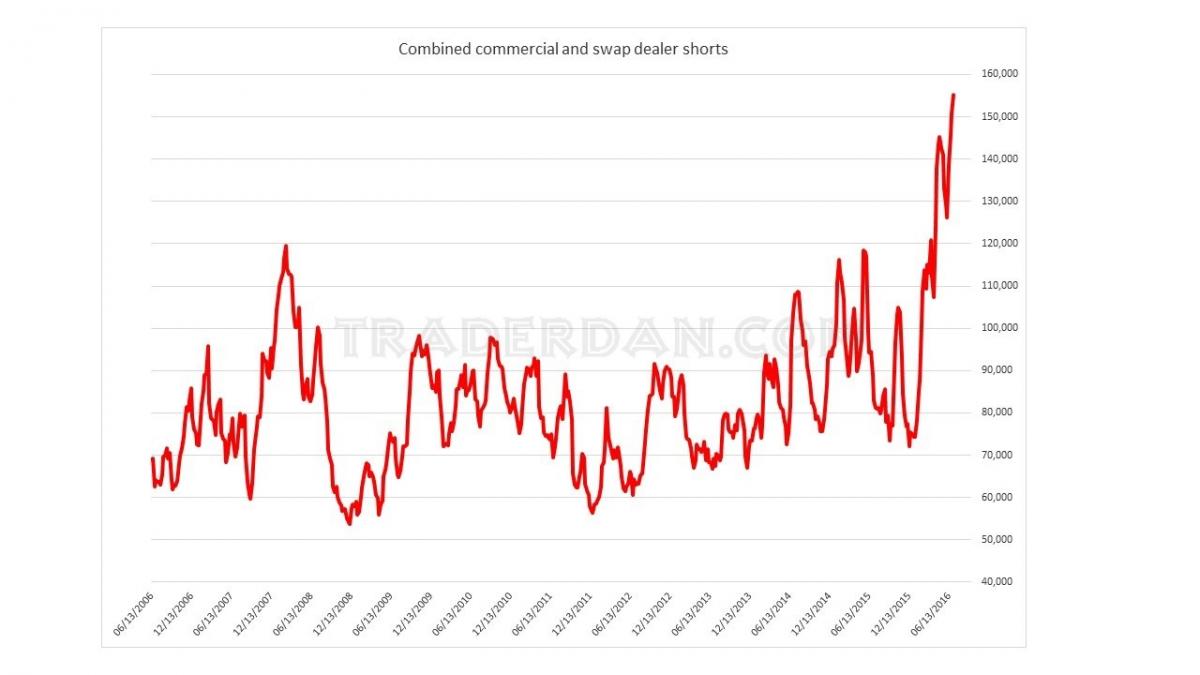
Stunning is it not?
I do not know how this impasse is going to end.

Do you see how the funds were able to strong arm silver through that very stubborn chart resistance level at $18.00. They then took it through $20 as they piled in yet further; however, determined selling by the Swap Dealers and Commercial hedge pressure took it back down well off its peak levels of the past week.
The result was a weekly CLOSE that set up a POTENTIAL (it is not confirmed yet) Spinning top formation. What silver does this upcoming week will therefore be very important. If it shows weakness, we have to keep in mind that there are an awful lot of new long positions that are already underwater due to the inconclusive close on Friday afternoon. With the higher margin requirements, those positions could be vulnerable if a downside support level fails to hold.

The problem we have in these computer-driven markets is that those machines know nothing of finesse like we long-time traders once practiced. They are either ALL-IN or ALL-OUT. Once any technical chart level gets tripped, the machines start firing off their buy or sell orders and the rest is then automatic. The larger this hedge fund long position gets, the larger the potential for a severe burst of selling becomes as the computers start closing out (liquidating) those longs IF A CHART SUPPORT LEVEL FAILS TO HOLD.
From what I can see of this chart, $18 is the key downside support level. That would need to hold on any subsequent retest or the funds will bail. So far there is no indication yet that the bulls have lost control of this market. The indicators noted show a rising ADX ( strong uptrend) while the trend following indicator below that notes the bullish posture. The spinning top for the weekly candle is a CAUTION sign only.
The bulls could negate this caution signal by taking out this week’s high and making a run at $22 next week.
Frankly, I would feel more comfortable with this market if it were to actually fall towards $18 and then hold rock steady. Also, if that fall were accompanied by a sizeable reduction in open interest and a lessening of this burdensome hedge fund long position that would be exactly what the doctor ordered in my view. Why? Because it would tell us that the big Swap Dealers and the Commercials were also covering shorts against that hedge fund long liquidation and that they were buying back part of that massive short position in sufficient numbers against the $18 level that they felt $18 was a good place to do so. We would want to see as much of that fund long liquidation absorbed by Swap Dealer and Commercial buying as possible all the while with the market holding at or above $18.
Such a scenario would actually be healthy for the market as it would portend that the probabilities favor a period of base-building/sideways/consolidation trading rather than a protracted sell off.
Whether or not we get such a development is anyone’s guess. I do not know what we will get nor for that matter does anyone else, especially the gold and silver perma-bulls.
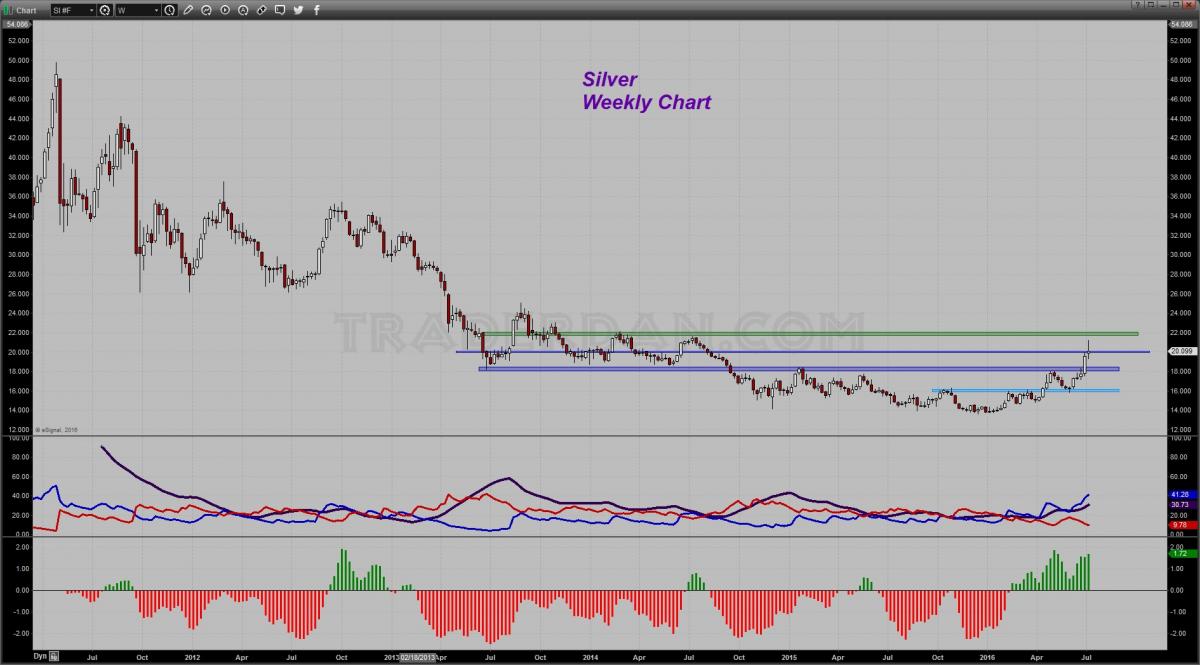
If you look again at that chart, you can see that silver spent a long time building a good base down below $18 with a good part of that time spent between $16.00 and $14.00. That has given end users of silver plenty of time to become acclimated to this price range.
It then spent about 8-9 weeks this year ranging between $18.00 and $16.00. Now that it has broken through $18 and failed so far at $20, perhaps it will spend some time working back and forth between $20.00 and $18.00. If that is the case and if the open interest can gradually bleed down and that hedge fund long side exposure can be whittled down in the process, this would pave the way for further gains down the road.
For now, we wait and see what the outcome in actuality will be.
We have our resistance and support levels. What happens next is up to Mr. Market
********
Courtesy of Trader Dan http://traderdan.com/
share
share
share
share
share
More from Silver Phoenix 500


