Silver Elevator Keeps Falling
 share
share
 share
share
 share
share
 share
share
 share
share
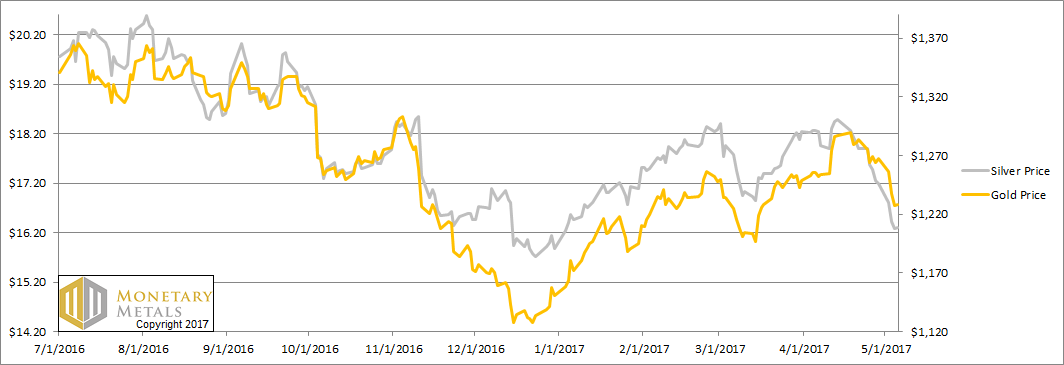
The dollar moved strongly, now over 25mg gold and 1.9g silver. This was a holiday-shortened week, due to the early May bank holiday in the UK.
The big news as we write this, Macron beat Le Pen in the French election. We suppose this means markets can continue to do what they wanted to do before the threat of Frexit, shutting off trade between France and the rest of Europe, and who knows what else Le Pen was plotting to do to the French people.
This will be a short Report this week, as Keith has been working hard on a paper to address the question of which metal will have the higher interest rate. Look for that tomorrow.
Below as the only true look at the supply and demand fundamental of the metals, but first, the price and ratio charts.
The Prices of Gold and Silver
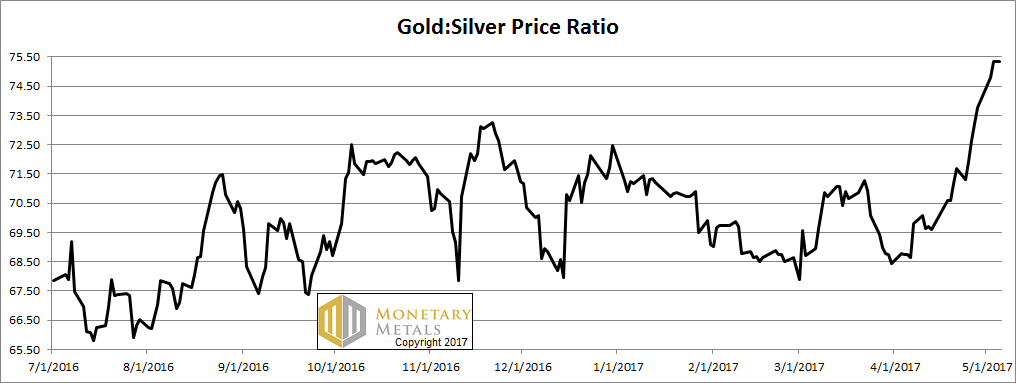
Next, this is a graph of the gold price measured in silver, otherwise known as the gold to silver ratio. It had another major move up this week, after a major move up last week and one the week before.
It now sits at the same level it was a year ago. If it breaks above 76, then the next resistance looks to be 80.
The Ratio of the Gold Price to the Silver Price
For each metal, we will look at a graph of the basis and cobasis overlaid with the price of the dollar in terms of the respective metal. It will make it easier to provide brief commentary. The dollar will be represented in green, the basis in blue and cobasis in red.
Here is the gold graph.
The Gold Basis and Cobasis and the Dollar Price
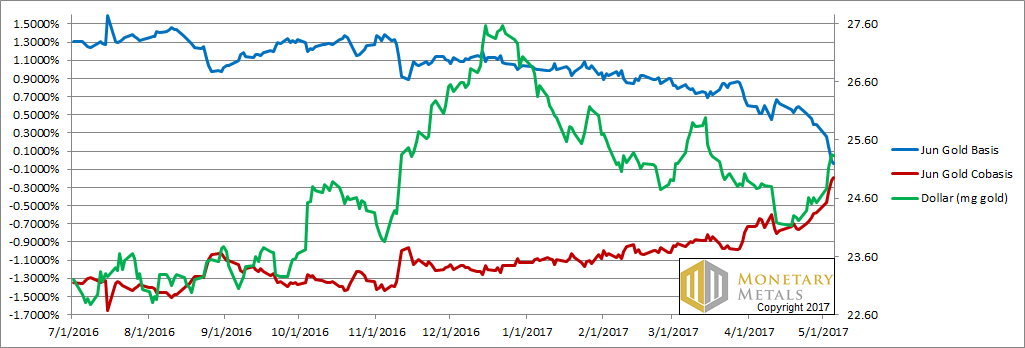
If we didn’t know better, we would say that as fast as the cobasis (i.e. scarcity, the red line) ran up, the price of the dollar (which is the inverse of the conventional view of the price of gold) ran up faster.
Actually, that is accurate. And consequently, our calculated fundamental price of gold fell over twenty bucks (though it’s still more than twenty bucks over the market price).
Now let’s look at silver.
The Silver Basis and Cobasis and the Dollar Price
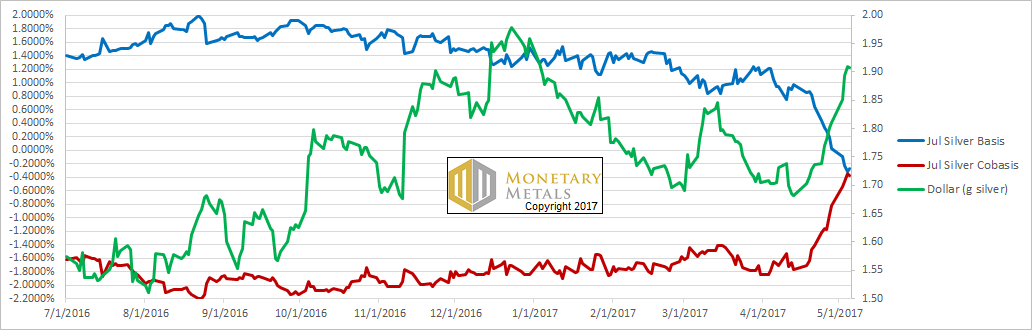
In silver, the same phenomenon occurred though with exaggerated degree.
Last week and the week before, we asked:
Some speculators definitely got flushed. However, the question is how many and how much?
Then we said:
Clearly it happened to more of them this week. And, unless the fundamentals get stronger, it is likely to flush even more leveraged futures positions. Our calculated fundamental price fell three cents this week, now a buck thirty under the market.
It happened to more of them this week. That’s what a rising cobasis with falling price of silver means. A selloff of futures. A flush of the leveraged speculators.
Unfortunately for them, owners of metal were also selling. Our calculated fundamental price of silver fell almost penny for penny with the market price. It remains about a buck twenty under the market.
We saw a technical analysis trader write a note this weekend. He said he plans to short silver on Monday. When the technicals and then fundamentals align, that can make for an interesting week.
Keith will be speaking at the Metal Writers Conference in Vancouver, at the end of the month.
© 2017 Monetary Metals
share
share
share
share
share
 Dr. Keith Weiner is the CEO of Monetary Metals and the president of the Gold Standard Institute USA. Keith is a leading authority in the areas of gold, money, and credit and has made important contributions to the development of trading techniques founded upon the analysis of bid-ask spreads. Keith is a sought after speaker and regularly writes on economics. He is an Objectivist, and has his PhD from the New Austrian School of Economics. His website is www.monetary-metals.com.
More from Silver Phoenix 500


