Silver Leads Gold Higher
 share
share
 share
share
 share
share
 share
share
 share
share
Chinese investors should be back on the “gold buying job” today. To understand why that is, please click here now. Twice a year, Chinese citizens celebrate “Golden Week”. Businesses are generally closed, and workers spend time with their families.
Chinese gold buyers should become quite active in the next few days, as Golden Week ends, and the nation goes back to work. India's Diwali festival is also approaching. In the coming weeks, physical demand for gold is likely to be relatively strong.
I've suggested that demand for silver could be even stronger than for gold, and the most recent price action shown by gold's “little brother” is superb.
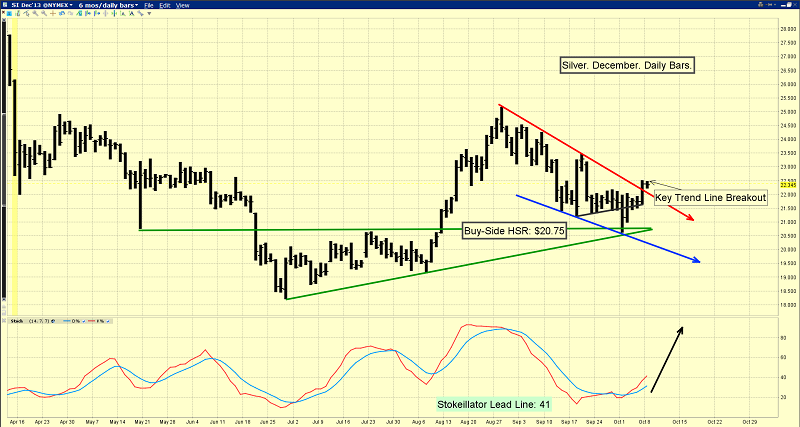
You are viewing the daily silver chart. A week ago I highlighted the $20.75 price zone as a key buying area, and you can see how nicely the price has surged from there.
Although it's still early, today marks the second day that silver is trading over the key red downtrend line, and that should attract buying from technical traders.
There's more good news for silver enthusiasts. Note the position of my stokeillator (14,7,7 Stochastics) at the bottom of the chart. The lead line is at about 41, and there's a crossover buy signal in play.
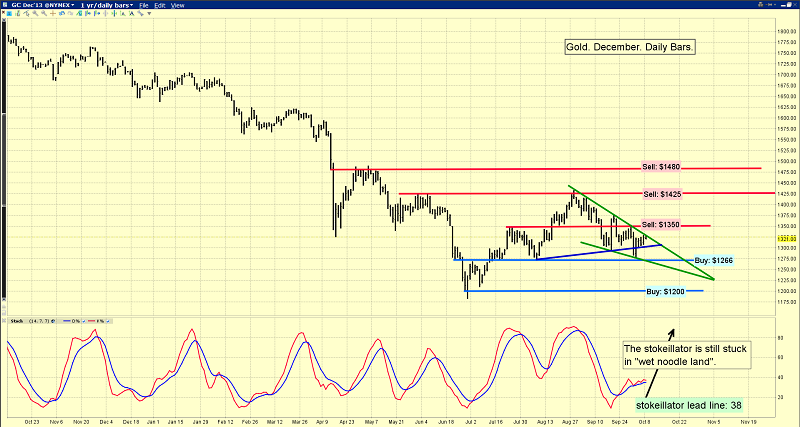
That's the daily chart for gold. Note the green wedge pattern that I've highlighted. It's very bullish. An upside breakout would be a very positive event.
While the stokeillator is still exhibiting action that is sluggish, it does favour the bulls.
The Dow has not been doing very well recently, and I've highlighted the precarious technical position of most general equities.
At this stage in the super-crisis, rising bond prices are bullish for gold. That should change, but not for several years. In the very short term, bonds are a bit overbought, but I don't see anything to be overly-concerned about.
That's the daily T-bond chart. There is a new stokeillator sell signal in play, and that could derail the gold rally in the short term. In the bigger picture, a decline from here should create a powerful head and shoulders bottom pattern.
In turn, that pattern could fuel a massive rally in T-bonds, and in gold!
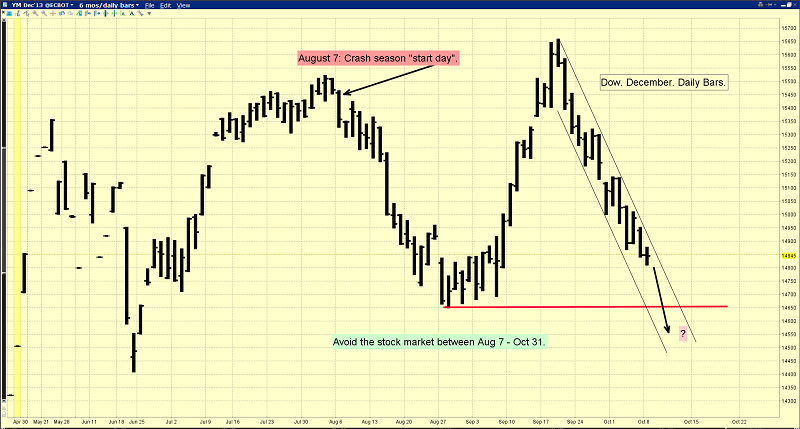
That's a daily chart of the Dow. For the past several decades, I've labelled the September – October time frame as “crash season”.
Each year I warn investors to exit the market around August 7th. My suggestion is to stay out of the market until the end of October.
Substantial fear created by the US government shutdown is beginning to envelop a lot of mainstream investors. Worse, it seems that many of them just entered the market, during the summer months. If so, they are already underwater on their positions.
Investor fear could get a lot worse, and the Dow could get hit a lot harder, if this shutdown drags on for a long period of time.
Gold stocks have exhibited very little volatility, despite the withering general equity market. Some analysts believe in an “imminent parabola”, while others are predicting a decline to the lows of 2008.
I don't think either scenario is the correct one at this juncture in time. Gold stocks are trading in the COP (cost of production) zone, and that is going to attract value-oriented investors.
Their buying is probably providing a “soft floor” under gold stocks, but momentum players are needed to produce the kind of “barn burner” rally that really excites the gold community.
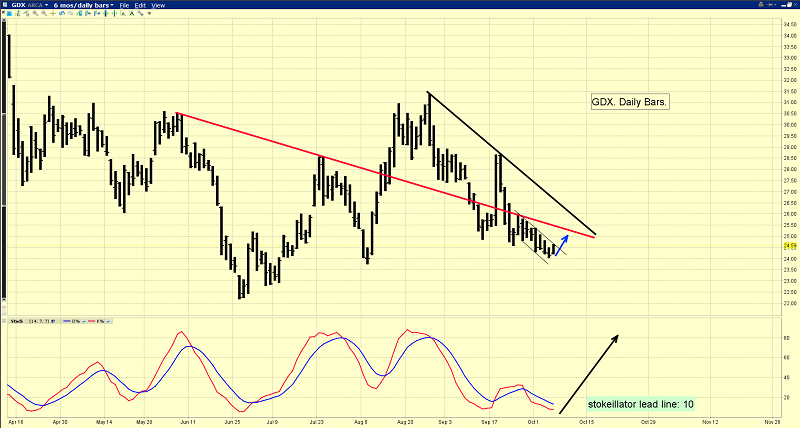
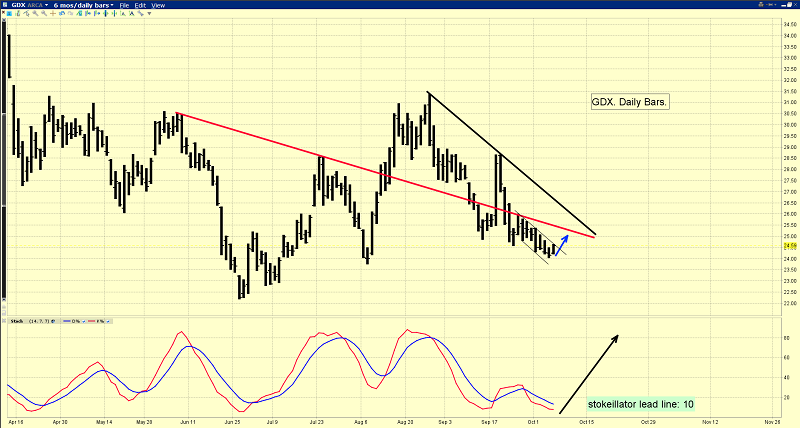
What technical event would trigger buying from these powerful momentum-oriented players? That's the daily GDX chart. Gold stocks have declined along with the Dow recently, but the decline is relatively modest.
Volatility is increasing in the general stock market now, while it's declining in the gold stock sector. A move above the thick black downtrend line is likely to trigger momentum-based buying.
There's also a red trend line that may be important. Note the powerful surge that occurred when Ben Bernanke announced “no taper” a couple of weeks ago.
In the very short term, GDX needs to push out of the price channel that I've highlighted with thin black trend lines. Note the position of my stokeillator at the bottom of the chart.
The lead line sits at about 10, which is a dramatically oversold condition for this key oscillator. Gold stocks are certainly not in a position that is appealing to momentum players. Regardless, technical analysis and liquidity flows in the physical markets in Asia suggest that both short and long term investors should be focused on the buy-side of the market.
Special Offer For Gold-Eagle readers: Send me an Email to freereports4@gracelandupdates.com and I’ll send you my free “Long Natty and Short Oil” report. For a number of years, the hedge fund bears have favoured natural gas, and the bulls have favoured oil. I'll show you why I think that's about to change!
Email: stewart@gracelandupdates.com
Mail to:
Stewart Thomson / 1276 Lakeview Drive / Oakville, Ontario L6H 2M8 Canada
Risks, Disclaimers, Legal
Stewart Thomson is no longer an investment advisor. The information provided by Stewart and Graceland Updates is for general information purposes only. Before taking any action on any investment, it is imperative that you consult with multiple properly licensed, experienced and qualifed investment advisors and get numerous opinions before taking any action. Your minimum risk on any investment in the world is: 100% loss of all your money. You may be taking or preparing to take leveraged positions in investments and not know it, exposing yourself to unlimited risks. This is highly concerning if you are an investor in any derivatives products. There is an approx $700 trillion OTC Derivatives Iceberg with a tiny portion written off officially. The bottom line: Are You Prepared?
share
share
share
share
share
 Stewart Thomson is president of Graceland Investment Management (Cayman) Ltd. Stewart was a very good English literature student, which helped him develop a unique way of communicating his investment ideas. He developed the “PGEN”, which is a unique capital allocation program. It is designed to allow investors of any size to mimic the action of the banks. Stewart owns GU Trader, which is a unique gold futures/ETF trading service, which closes out all trades by 5pm each day. High net worth individuals around the world follow Stewart on a daily basis. Website: www.gracelandupdates.com.
More from Silver Phoenix 500


