Silver Market Update
 share
share
 share
share
 share
share
 share
share
 share
share
Much of what is written in the parallel Gold Market update applies equally to silver, and it will not be repeated here.
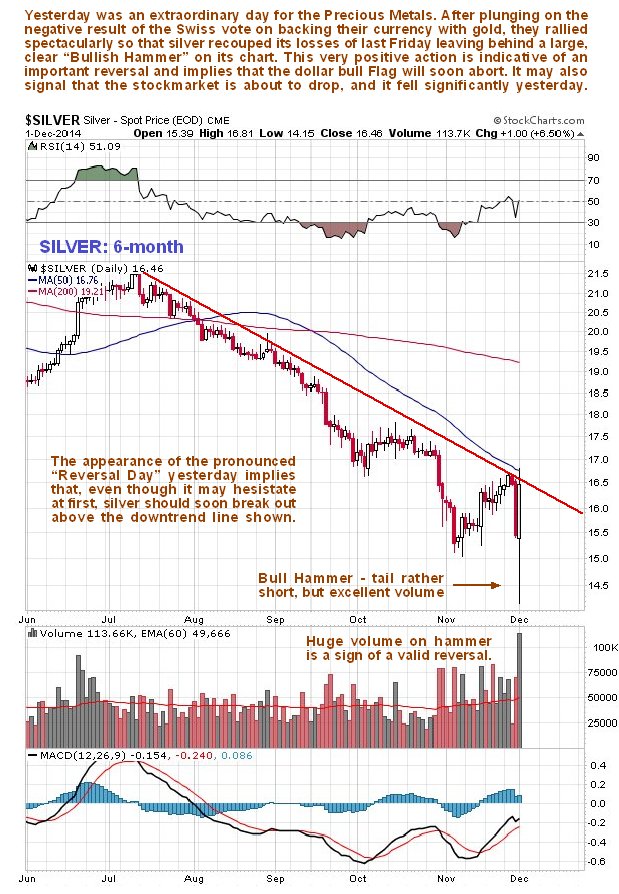
On silver’s 6-month chart we can see how it broke well below its November lows in the early trade yesterday, in response to the “No” vote in Switzerland on the referendum on whether to partially back the Swiss Franc with gold, but then it came back strongly on big volume to almost entirely erase Friday’s sharp losses, leaving behind a large Bull Hammer on its chart. While the “tail” of this hammer is rather short in relation to its “real body,” meaning the trading between the open and the close, the big daily range and massive volume means that it can be considered as a valid reversal hammer. This action is indicative of an important reversal, and here we should note that it is normal for the price to back and fill for a little while after the appearance of such a hammer, before the nascent uptrend it signifies gets underway, which is why we are not concerned by today’s reaction. As we can see on the chart, the price is still being constrained by the downtrend line shown and the 50-day moving average, but these impediments should not stop it for long – once the price does break above them it should advance smartly, especially as sentiment towards silver has been terribly negative in the recent past.
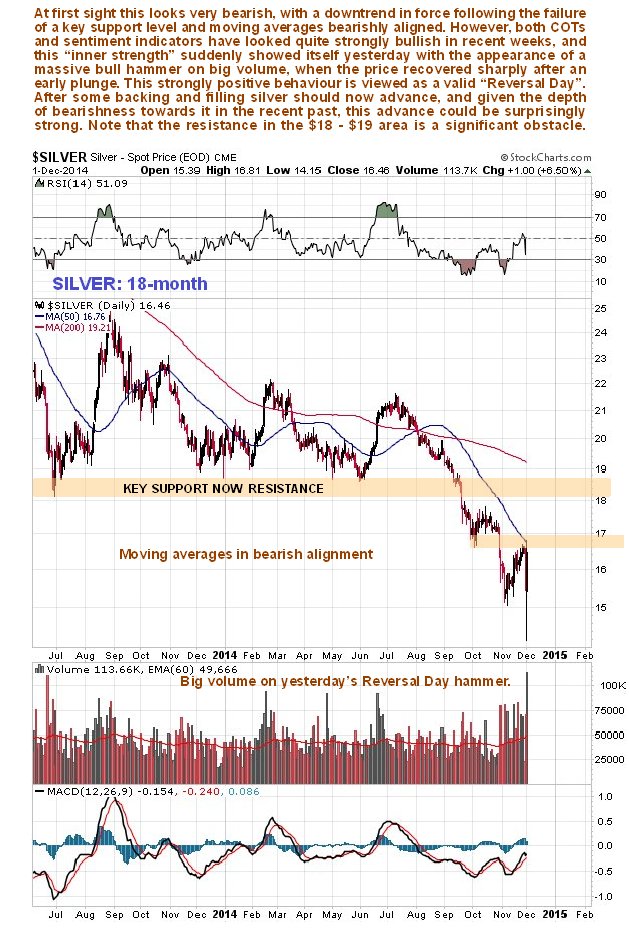
While silver’s 18-month chart admittedly looks awful at first sight, we can see yesterday’s spectacular hammer on it, which is viewed as calling the final low – even if the price does break below this low, it is unlikely to drop back much more. This chart makes plain that the strong resistance at the failed former support level in the $18 - $19 area will be a “tough nut to crack”, but silver could get back above this level surprisingly fast once the tide turns – and it is thought to have yesterday, especially if the dollar goes into a tailspin.
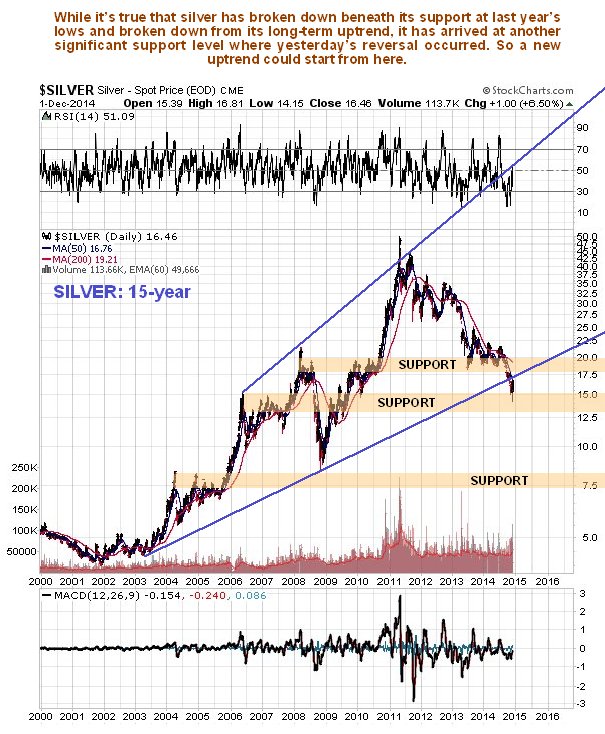
Like gold, silver has broken down from the long-term uptrend shown on its 15-year chart, but the break is rather marginal, and it has arrived at another significant support level which doubtless helped to generate yesterday’s reversal. This is a good point for it to reverse and begin a major uptrend.
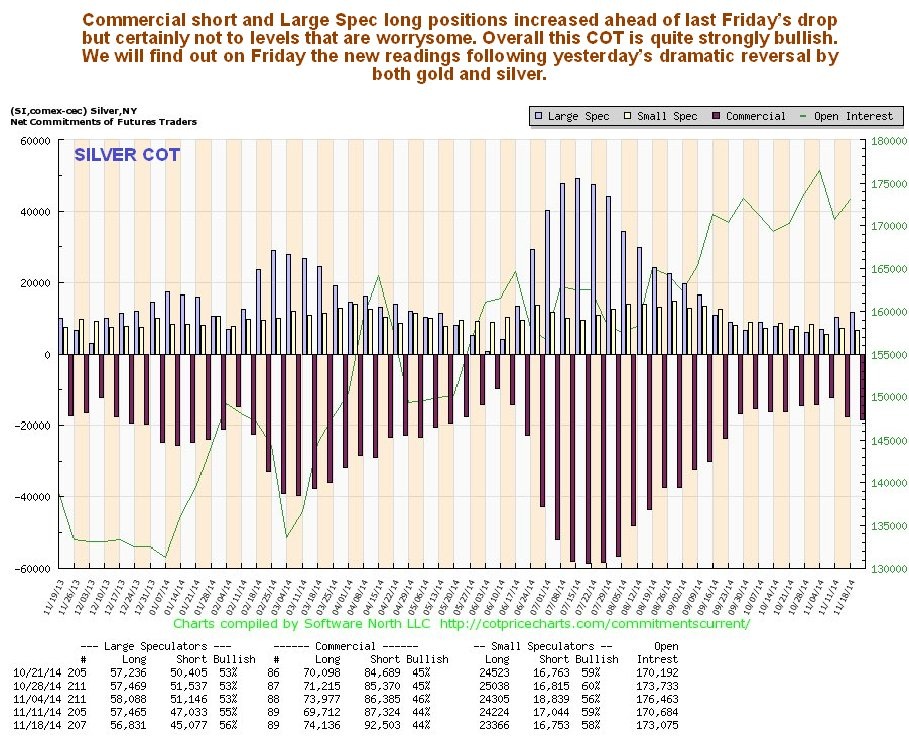
Silver’s latest COT looks quite strongly bullish, more so than gold’s. While Commercial short and Large Spec long positions did expand somewhat over the past week or two, that’s consistent with the weak rally that occurred, and preceded Friday’s sharp drop into Monday morning. The current readings certainly allow plenty of room for a big rally to develop. It will be interesting to see what the new chart looks like on Friday/Saturday after yesterday’s big turnaround.
Click on chart to popup a larger clear version.
The Silver Hedgers chart shown below, which goes all the way back to late 2007 and is another form of COT chart, makes clear that historically, readings are quite strongly bullish now.
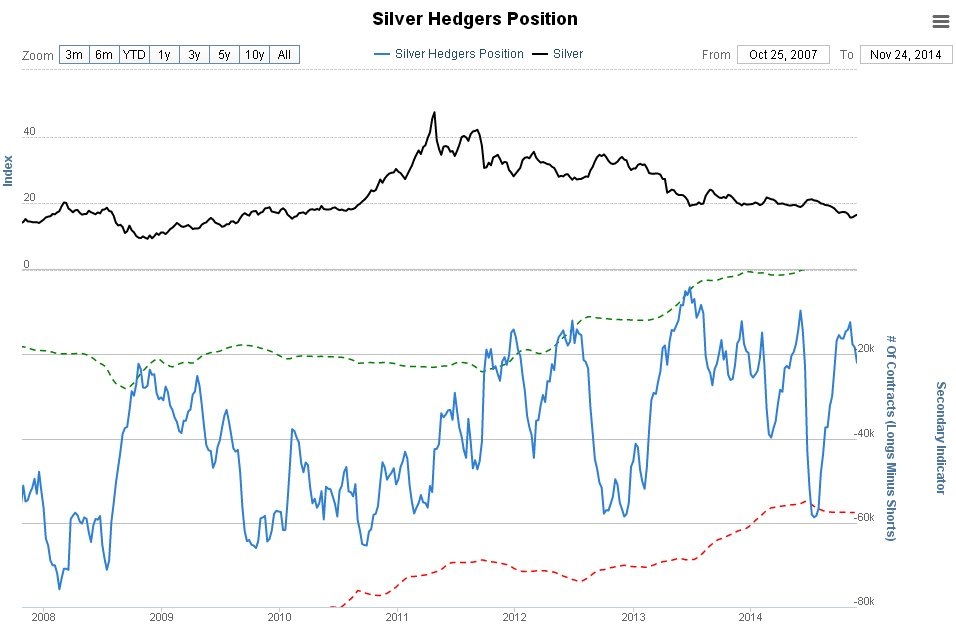
Click on chart to popup a larger clear version.
Chart courtesy of www.sentimentrader.com
Sentiment towards silver has been and still is in the basement, as the Silver Optix, or optimism index chart below makes plain. This is a strongly bullish indication.
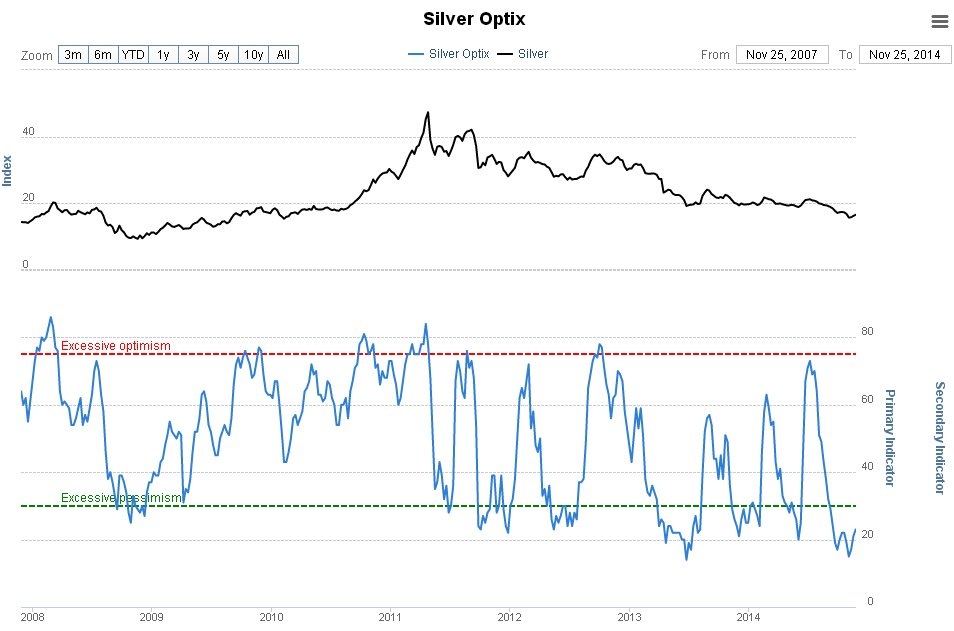
Click on chart to popup a larger clear version.
Chart courtesy of www.sentimentrader.com
share
share
share
share
share
More from Silver Phoenix 500


