Silver Market Update
 share
share
 share
share
 share
share
 share
share
 share
share
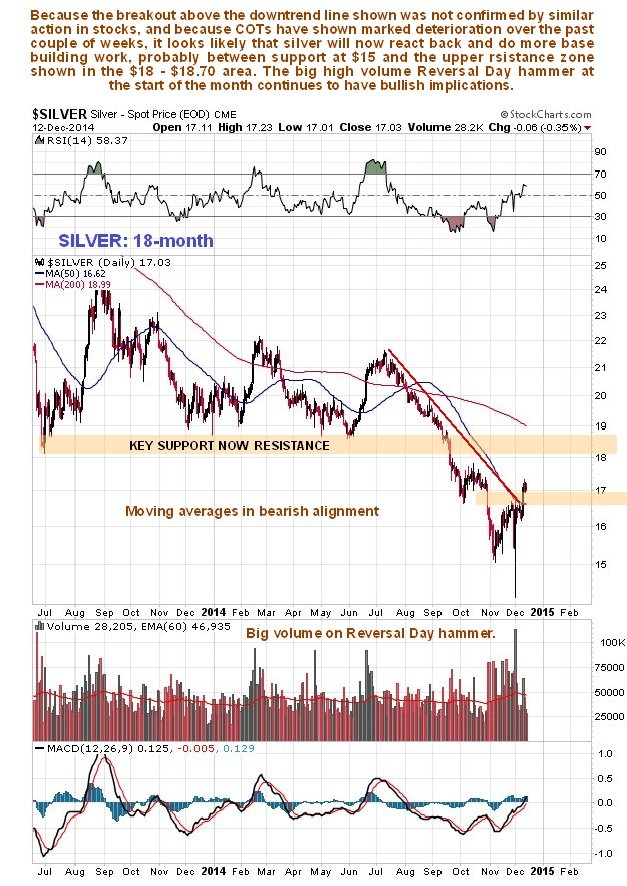
Silver broke out of its 5-month downtrend last week as expected, but, as with gold, the move was unfortunately not confirmed by action in stocks, which have continued to drift lower. When this fact is combined with the ramping of Commercial short and Large Spec long positions over the past couple of weeks, it starts to look like this breakout was false. Certainly a reaction is looking a lot more likely now.
On its 6-month chart we can see the breakout move last Tuesday, and how there has been no follow through, increasing the risk of it turning lower again. However, the high volume bull hammer at the start of the month continues to have bullish implications, so what may happen here is that silver backs off to do more base building work before a sustained advance can get underway. A good place for it to stop on a reaction would be the support at $15, and it could drop further towards the support at the intraday hammer low. A possible scenario is shown which should not be taken literally.

The 18-month chart gives us more perspective. On this chart we can readily see the importance of the support at multiple lows just above $18 – so a breakout above this level will be an important technical milestone. Overall it has to be said that this chart still looks bearish with the recent break to new lows and moving averages in bearish alignment, although the high volume bull hammer is a sign of a reversal.
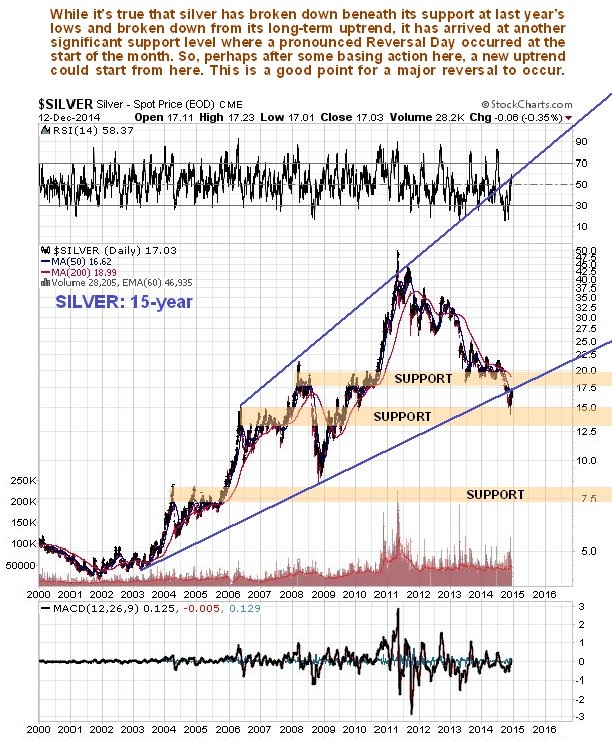
The 15-year chart is much more encouraging. Although as we can see silver has broken down from the long-term uptrend shown, the recent Reversal Day occurred at another zone of strong support, which certainly has the power to generate a reversal. The latest COTs and stock non-confirmation may be signaling that more basing work is needed in this support zone before a sustainable uptrend can get going.
Silver’s latest COT shows marked deterioration from its earlier strongly bullish tone, with Commercial short and Large Spec long positions ramping up substantially over the past couple of weeks, increasing the chances of it reacting back here.

Readings on the latest silver hedgers chart, which is a form of COT chart, and goes back to before the start of 2008, have swung from being quite strongly bullish to being in neutral territory, again allowing scope for a reaction.
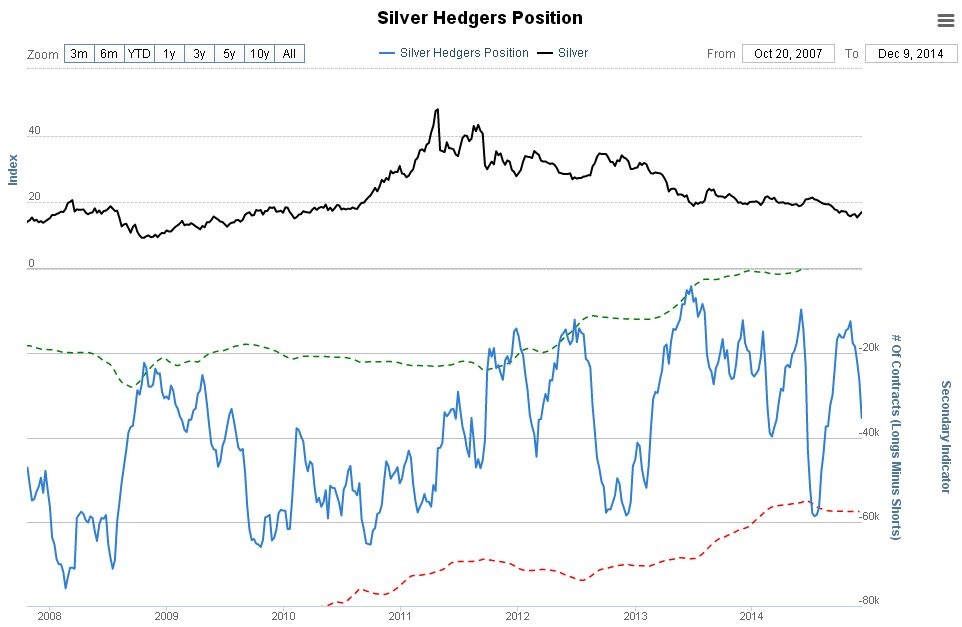
Chart courtesy of www.sentimentrader.com
A similar situation exists with the latest silver optix, or optimism index chart. Although the reading on this chart is still on the bullish side, it is much less so than a few weeks back.
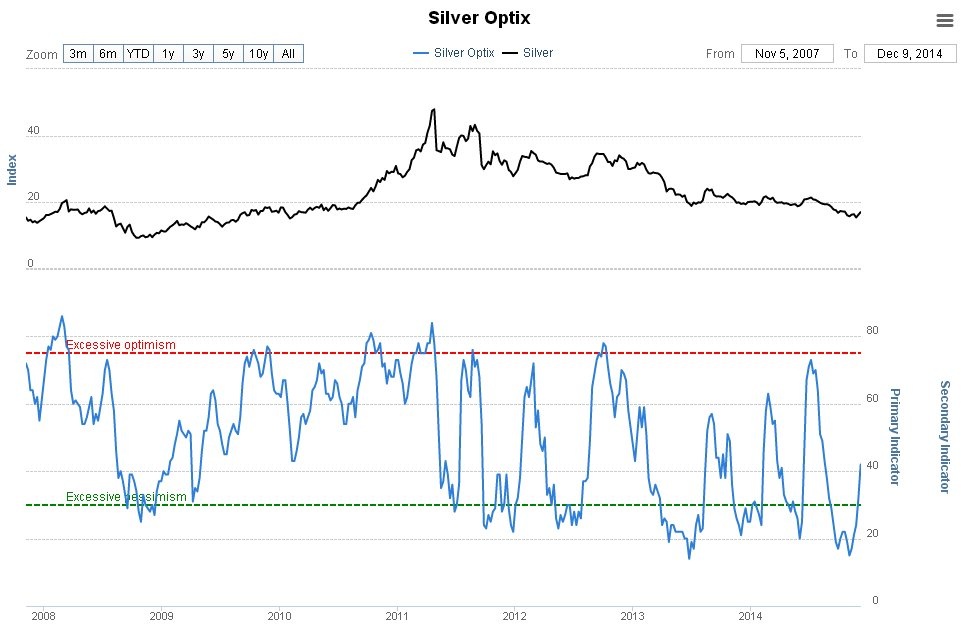
Chart courtesy of www.sentimentrader.com
In the parallel Gold Market update we discuss what will likely ensue if the plunging oil markets trigger a market crash. The conclusion is that this will be the perfect excuse to introduce a global coordinated QE program, possibly headed up by QE Grand Master Abe of Japan. As usual much of what is written in the Gold Market update applies equally to silver.
share
share
share
share
share
More from Silver Phoenix 500


