Silver Price Analysis
 share
share
 share
share
 share
share
 share
share
 share
share
As I have been noting of late, both gold and silver have been trapped in sideways trading patterns for some time now, meaning that there really has not been a whole lot worth saying about the price action in either metal.
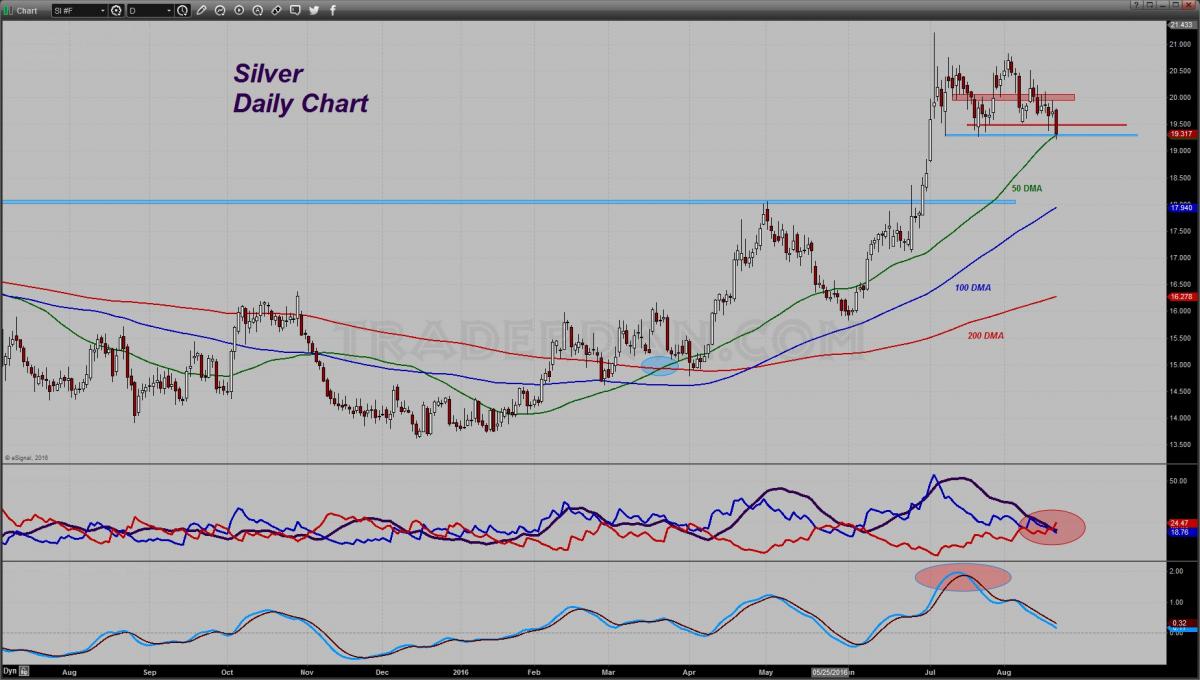
That MIGHT POSSIBLY be changing in regard to silver. The reason is simple – price is down at the very bottom of the sideways trading range that has been intact for nearly seven weeks.

Additionally, the price fell through the 50-day moving average today. This is the first time it has done that since early June, although it did recover slightly ahead of the closing or settlement price – just barely however!
One other thing worth noting, the bottom technical indicator has remained in a bearish posture since the middle of July, while the ADX/DMI has kept the bulls in charge with the +DMI remaining above the -DMI over the sideways trading pattern. For the first time in a long time, however, we have gotten an actual sell signal in those DMI lines.
As you can see, the actual ADX line itself has been moving steadily lower after peaking in mid-July, a sign that the ferocious uptrend that had been taking place through June was going to be pausing. It continues to move lower indicating the choppy price action during this sideways trading action. With the upside crossover of the -DMI above about the ADX line and the +DMI, this might possibly be the start of a bigger retracement lower in price. It will all depend on whether today’s low now gives way…and silver subsequently closes below that 50-day moving average.
That is a key technical chart level. Consequently, if it is violated on a closing basis, we are going to see some hedge fund long liquidation start up.
The reason why this should concern silver traders is that the current hedge fund long side exposure in this market remains substantially lopsided. While this group of large traders has reduced the size of their once record long positions over the last three weeks, the reduction has been minimal, i.e. only about 3,500 or so out of the peak at 104,658.
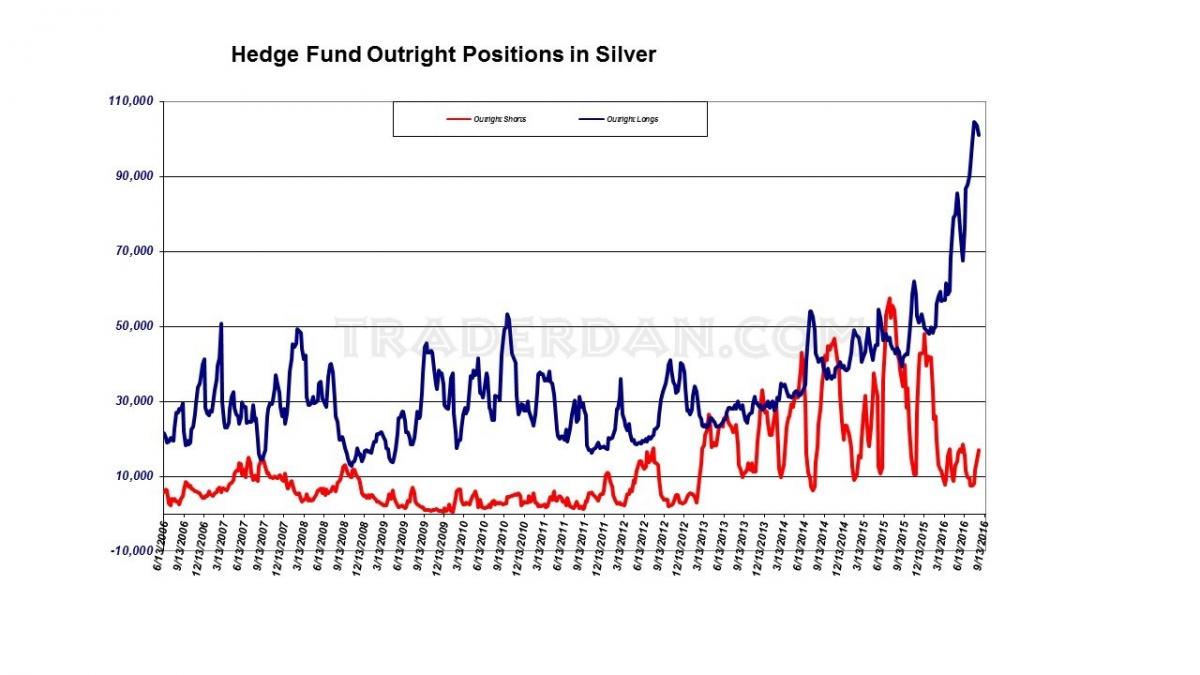
What they have done in a bit more aggressive fashion is to begin taking on some fresh short positions although as you can see from the chart, the overall position is quite muted compared to their aggressive long side bets.
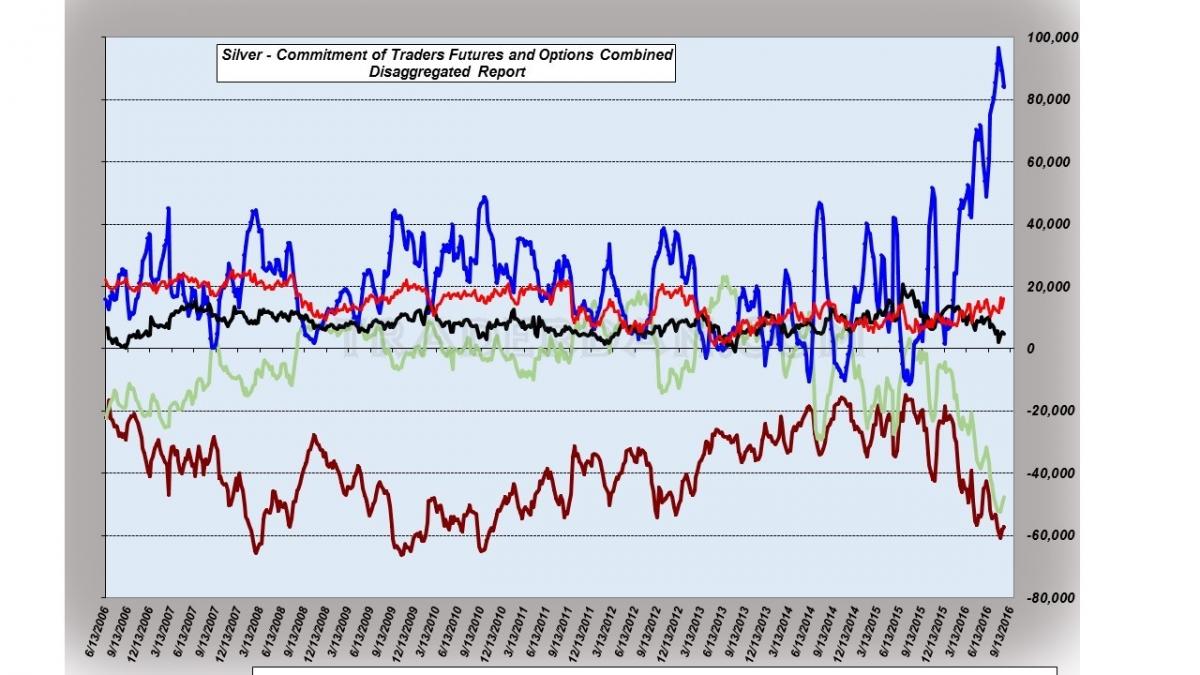
You can see the turn lower in the record NET LONG position by the hedgies. You can also see that the Commercials and Swap Dealers were busy covering some of their large short positions into that hedge fund selling.

I should note here that this is the reason for the sideways trading pattern we have seen in silver recently. Without that constant barrage of heavy hedge fund buying, the market is too heavy to break out to the upside. However, the short covering by Commercials and Swap Dealers has been there to absorb the still modest selling by hedge funds, whether from liquidation of long positions or the addition of fresh shorts.
That would change IF A KEY DOWNSIDE TECHNICAL SUPPORT LEVEL fails. We would see much more aggressive selling by hedge funds, which would swamp buying related to Commercial and Swap Dealer short covering efforts.
Also worth noting, while we have seen the hedge fund positions whittled down somewhat on the long side, when viewed as a percentage of the total open interest, something I prefer to use to allow for growth in the futures market participation over the years. Nonetheless, the outright long position of the hedge funds remains dangerously high. As a matter of fact, it is barely, just barely, off the record peak.
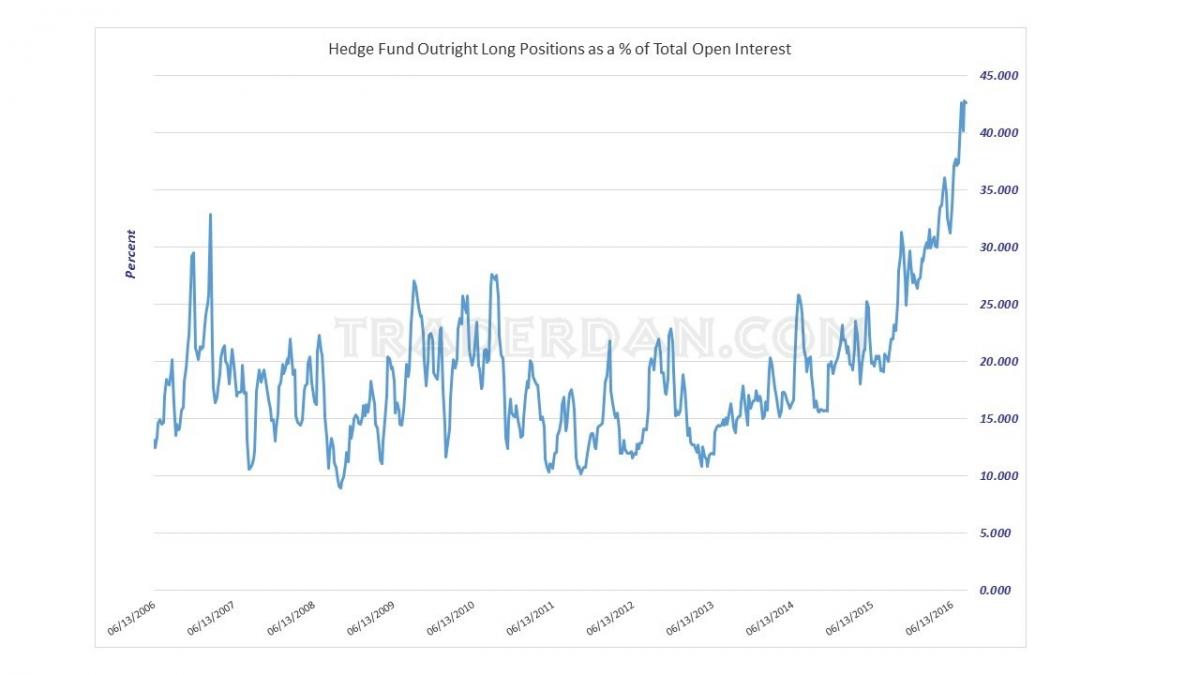
If the bulls, especially those hedge funds, are going to prevent a deeper selloff/move lower, they are going to have to come out buying in a big way Sunday evening/Monday morning of next week.
The interesting thing about this sideways price action in silver is that it has been occurring against the backdrop of a generally weaker US Dollar.
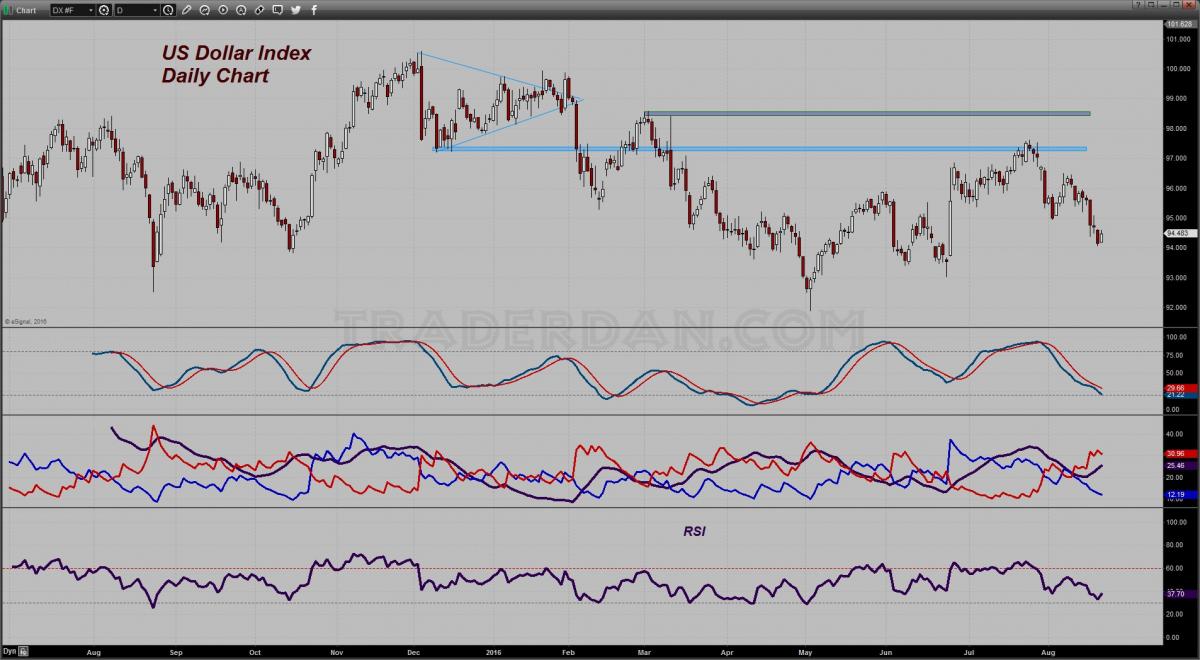
One would have thought that with the Dollar moving down as much as it has since its peak in late July, that silver would have benefited tremendously and would have gone on to take out its overhead chart resistance and powered higher. That it has not is disconcerting. It could be that the longs are simply exhausted in this market and lack the resolve/firepower to aggressively pile on the necessary amount of new long positions to start a fresh leg higher.
Either way, silver is looking vulnerable here. Bulls will need to get it back through $20 on the topside to blunt some of this building negative pressure.

That should spark some light short covering by some of these recent hedge fund converts to the short side. However, they would really need to clear at least $20.30 to get something more notable going to the upside.
Here is another point of notice.
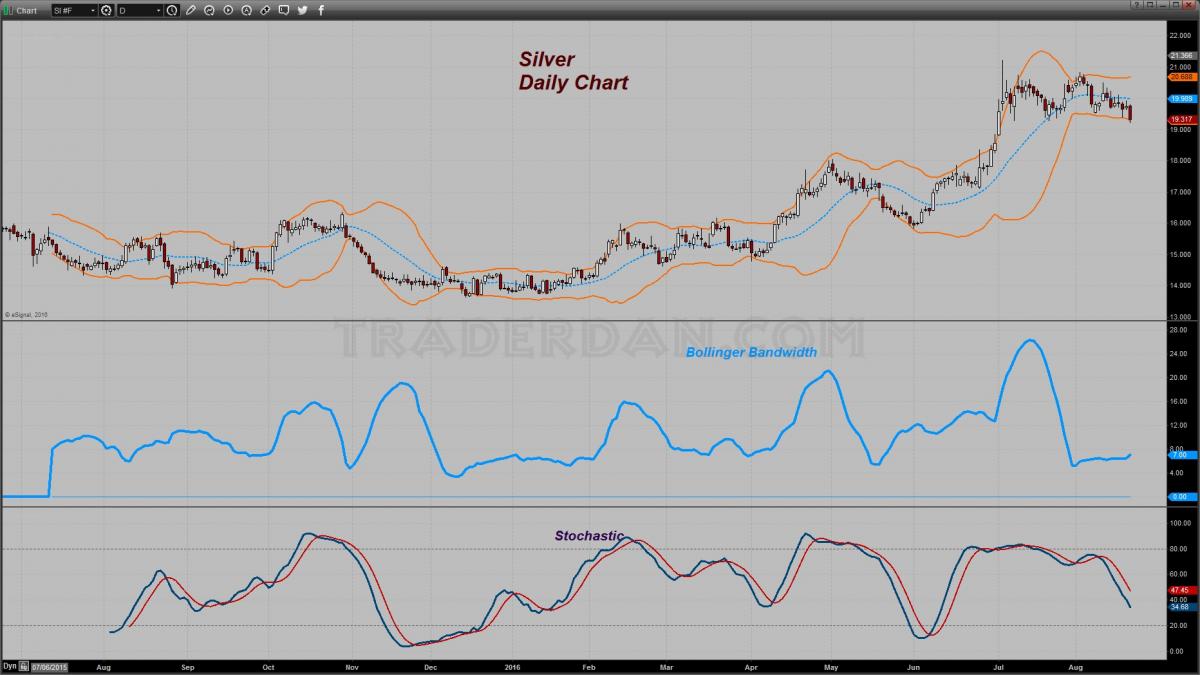
I have put up the Bollinger Bands on the daily silver chart along with two indicators. The first is the Bollinger Bandwidth, which measures the distance between the upper band and the lower band, and the second is a simple stochastic indicator.
When a market is trending, the Bollinger Bands are generally widening out, no matter what direction the actual price is going, up or down. In other words, a TRENDING MARKET is accompanied by a widening BANDWIDTH indicator. When the BANDWIDTH is contracting or falling, the market is moving sideways. If it was trending higher beforehand, that means price is retreating…but not breaking down sharply causing the market to consolidate in a sideways pattern to see whether or not it has had sufficient time to get end users and sellers some time to become accustomed to the new and higher price.
When a market enters a sideways trading pattern, or is ranging and not trending, the Stochastic indicator is a very good one to employ for taking buy or sell signals. Generally, as the indicator moves down into the oversold level and the lines then complete an upside crossover, traders can buy the market waiting for price to rally sufficiently to move to the overbought level at which point the trade is closed and can then be reversed to go in the opposite direction if that is amenable to the trader.
Notice that when the Bandwidth indicator turned lower, the stochastics would generally soon afterwards complete a bullish upside crossover which commensurate with the Bandwidth indicator widening out again as price moved higher.

What we have as of today (Friday) is that the Stochastic indicator shows both lines still moving lower together with neither one suggesting an upward direction change. Also, the Bandwidth indicator is giving some hint of actually turning higher even as the stochastic line move lower. That is a change from the previous action of both indicators when the Stochastics tended to moving higher or about to turn higher as the Bandwidth indicator began to rise or steepen out.
What we MIGHT POSSIBLY be seeing here is a growing potential for some more volatility…although this time to the downside.
This next week should be an important one. It will confirm whether or not that fresh sell signal from the DMI lines remains in force and if the 50 day moving average can offer any magic for the silver bulls. It will also confirm if those Stochastic lines are going to start turning higher once again or have further room to fall lower. If this is what happens, it is not too difficult to visualize a rather abrupt drop to $18. We shall see…Bulls have their work cut out for them.
********
Courtesy of Trader Dan http://traderdan.com/
share
share
share
share
share
More from Silver Phoenix 500


