Silver Prices 100 Years
 share
share
 share
share
 share
share
 share
share
 share
share
The graph below shows 100 years of silver and crude oil prices on a log scale using the annual average of daily prices. Example: The price of silver peaked in 1980 at about $50 but the smoothed annual average was about $16.
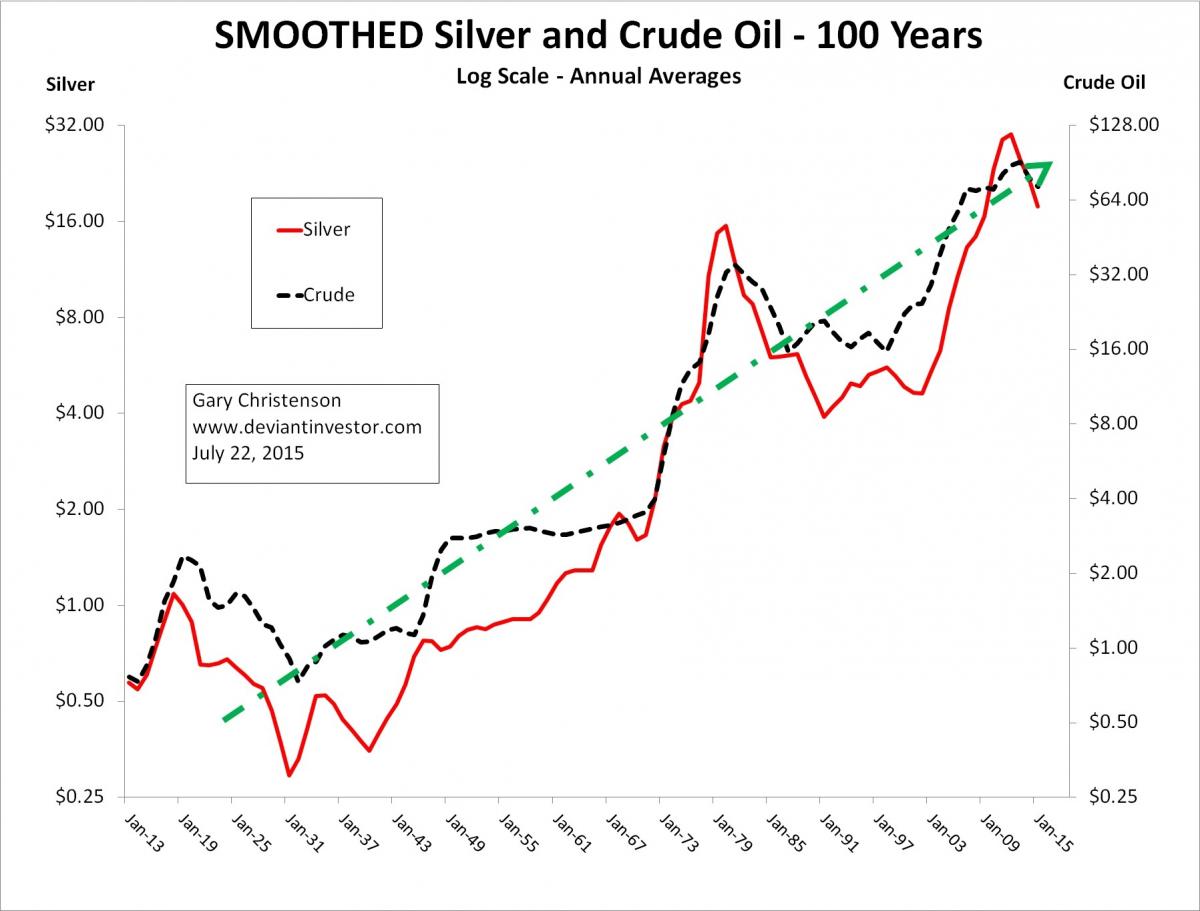
Prices slowly increased until the 1970s. After the expensive Vietnam War and the War on Poverty, President Nixon broke the connection between the dollar and gold, and the prices of silver and crude oil rose rapidly, along with debt and money in circulation.
But price does not tell the whole story.
- In 1970 the US government had stockpiled almost 2 billion ounces of silver. By the early 2000s that stockpile was essentially gone and had been sold into the physical market depressing prices after the 1970-1980 run up.
- Silver prices are largely set on the COMEX via paper futures contracts, not actual physical metal. Much has been written about the manipulation of prices via those paper contracts, High Frequency Trading, hedge funds, and other large players with an agenda regarding silver prices. Assume all important markets are managed and strongly influenced by large players. Many settlements regarding price manipulation are proof.
- Silver prices were recently smashed on the COMEX – Sunday night July 19. It has happened before and will happen again. But prices for real physical Silver Eagles show that the % premiums charged by dealers substantially increased. The COMEX price decreased far more than the actual prices for physical metal. This same pattern occurred in other price smashes in 2008, 2011, and 2013.
IT IS AN EXPONENTIAL WORLD
Examine the graph of the US national debt divided by population since 1971. The line increases almost linearly on a log-scale graph, which means population adjusted national debt is increasing exponentially – about 7.8% per year since 1971. Silver prices and crude oil prices are also shown.

The annual prices of silver and crude oil have been smoothed with a moving average to show the long term trend – exponentially higher, similar to the increase in debt.
Long Term Conclusion
Global debt has exceeded $200 Trillion and is climbing rapidly. US national debt has increased roughly 10% per year for the past 6 years. Global and US debt will continue to increase. Silver prices will also increase, along with the prices for food and energy and everything you need. The road to higher debt and higher prices will be neither smooth nor easy. Expect a few crashes and reversals along the way.
Medium Term Conclusion
By dozens of measures silver is deeply oversold and due to rally. It always has rallied from similarly oversold conditions in the past and probably will this time – tomorrow, next week, or next month.

Short Term Conclusion
Silver prices are deeply oversold and could rally substantially from here, but the trend is still down and until High Frequency Traders, Hedge Funds, and large investors believe the trend has turned up, more downside is possible. If you have stacked silver, you don’t care. If you are buying, this is good for you. If you are worried that silver will stay low forever, look at government expenditures and the above graphs again.
FUNDAMENTALS
There is solid demand for silver, mine supply is growing slowly and may, due to persistent low prices, even decline. Industrial demand is increasing and I expect investor demand will soon surge, thanks to low prices, global financial instability, and a growing realization that paper and debt can lose much of their supposed value, while silver will remain valuable for the next century.
For intelligent analysis regarding the fundamentals of silver, buy the book that Steve St. Angelo has written. The link is here. I have the book, I found it informative and easy to read and understand. He packs important information in his many graphs and data and if you care about silver, buy his book. By the way, this is an unsolicited, unpaid recommendation. I receive no compensation, just the satisfaction of recommending a valuable resource.
As I have said several times in the past, silver is going to $100 per ounce. Yes, I know, that sounds extreme, but consider:
- Debt is exponentially increasing and silver prices will erratically follow.
- Silver sold for under $9 on the COMEX in late 2008. By April of 2011 it sold for almost $50 on the COMEX. Yes, it moved too far and too fast, and has corrected since then. Based on 50 years of history, it will spike higher and crash again.
- It is not a stretch to think that a crazy rally in silver prices will blow past $50 per ounce and go much higher. How much higher is dependent upon central bank “printing,” government intrusion in the markets, panic, and potential crashes in bonds, currencies, and stocks.
- When the $100 Trillion bond bubble crashes, as it eventually must, panic and fear will motivate people to act. One choice will be the purchase of real assets, like silver, gold, land, diamonds and more.
- If (when) we experience a crash in bonds, stocks, or currencies, do you think central banks will do nothing and let them correct naturally, or will they print currencies, like never before, to reflate the bubbles? Yes, they will print and some of those extra dollars, euros, and yen will find their way into the safety of silver and gold, boosting their prices.
- Stack your silver and trust the central bankers to do what they do best, print currencies, create inflation, and facilitate government deficit spending.
- $100 silver is coming, perhaps sooner than most believe possible.
Gary Christenson | The Deviant Investor
share
share
share
share
share
 Gary Christenson is the owner and writer for the popular and contrarian investment site Deviant Investor and the author of the book, “Gold Value and Gold Prices 1971 – 2021.” He is a retired accountant and business manager with 30 years of experience studying markets, investing, and trading. He writes about investing, gold, silver, the economy and central banking.
More from Silver Phoenix 500


