Silver Warming Up Nicely
 share
share
 share
share
 share
share
 share
share
 share
share
 Since silver hit a low of $13.63 on the 14th December last year, it has been generally up for silver with some predictably wild turns on the way. As of today, silver has risen as high as 25% while its big brother, gold, has seen a parallel rise of 23% to its recent high on March 11th. Since then, silver has been making up lost ground on gold to now slightly outperform gold.
But that is why investors buy silver, is it not? It is a leveraged play on gold without some of the risks of holding indirect instruments such as derivatives or mining companies. When this nascent bull market finally ends years from now, expect silver to return double the performance of gold.
However, the tantalizing pointers to a confirmed bull market rather than a hyped one are slowly coming into place. I have talked about how the gold to silver ratio can help in that regard in a previous article, but another one concerns the silver price itself. Take a look at the semi-log monthly chart of silver in relation to its 20-month moving average.
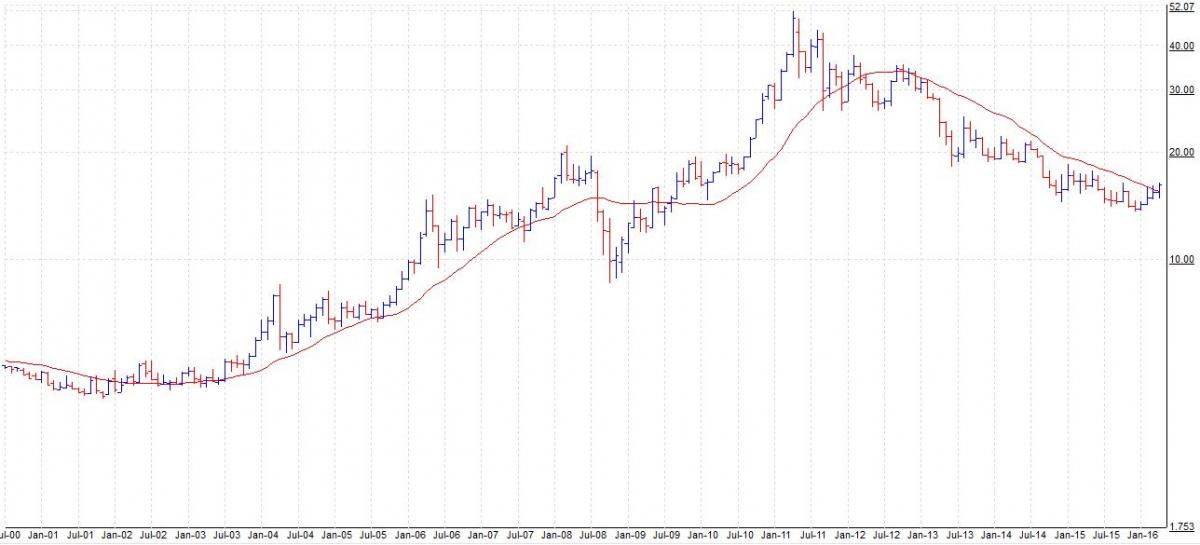
As you can see, the history of silver bears and bulls since 2001 has been a battle with this moving average. When silver completed a whole month’s trading range above the moving average, a multi-year bull ensued. Likewise, when silver completed a whole month’s trading range below this moving average, a multi-year bear market ensued.
Currently, silver is battling to get above the 20-month moving average, so from this point of view, a new bull won’t be confirmed until at least next month. However, the same chart for gold, which follows the same principle, broke completely above its 20-month moving average in March. As I said, it’s all slowly coming together.
The one fly in the ointment are the Elliott wave counts since no clean impulse wave is visible in silver’s recent run. Does this mean this silver bull is about to be strangled at birth? Not quite, as I am not so sure a clean impulse wave can be clearly demonstrated when silver began its long bull run back in 2001. I take that to mean that Elliott Wave is neutral on this matter.
After all, it is not always the case that bull markets come racing out of their blocks like thoroughbred racehorses. Sometimes, they begin cautiously as the bullish-bearish consensus pulls the metals backwards and forwards until a clear winner comes forth.
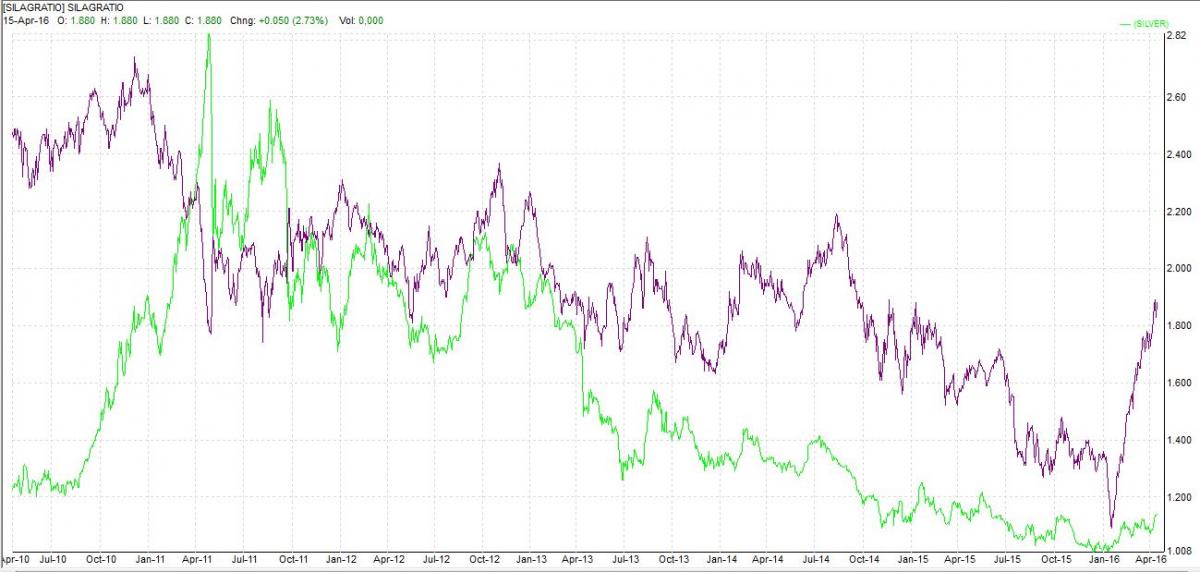
What about silver mining stocks? No one could have failed to have noticed the rip-roaring run of precious metals mining equities recently. In fact, the benchmark Global X Silver Miners ETF (SIL), is currently out leveraging silver by a factor of six to one!
That would suggest a sizeable pullback is due soon, though a rough and ready chart showing the ratio of the silver and SIL price reveals that, though it is high at 1.9, it has been higher. That ratio is shown in blue with silver in green. Note the ratio has been higher even during this five-year bear market. It was at its highest back in December 2010 at 2.7. However, caution is urged at this stage.
Further analysis of silver can be had by going to our silver blog at http://silveranalyst.blogspot.com where readers can obtain subscription details for the Silver Analyst newsletter. A free sample copy can be obtained by emailing silveranalysis@yahoo.co.uk.
share
share
share
share
share
More from Silver Phoenix 500


