Stock Indexes Stuck Under Next Resistance Level
 share
share
 share
share
 share
share
 share
share
 share
share
As we close out this very successful week of trading, we wanted to provide some additional analysis and research regarding our belief for what next week holds. Before we get into the analysis for next week, lets take a bit of time to recap this week's success.
Our recent trade alerts, UGAZ, FAS, TECL, SIL and GDXJ have all been moving up quite well. UGAZ, FAS and TECL have been rocketing higher – as we predicted. Today, we closed our TECL position to lock in the 18.3% gains for our members with the intent to reenter with new trade opportunities as our strategies tell us. The single point of success for all of us is to manage our assets well in an attempt to achieve greater long-term success. We are still holding the other trades open for larger gains next week.
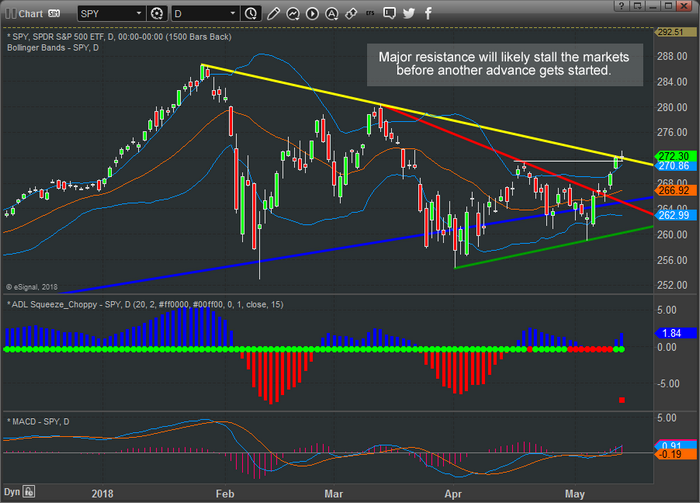
Now, onto our research and analysis. This Daily SPY chart shows us that price has already breached the recent price peak level – indicating that an attempt to push to new price highs should continue. Yet, the downward sloping resistance level (in YELLOW) is the current boundary for price and price has stalled at this level. This is to be expected after such a nice run upward and with price reaching this resistance level. We do expect price to advance much higher over the next few weeks, but we are also aware that price may rotate a bit near this level before attempting to breakout to the upside.
This week’s strong rally we warned was about to happen and showed this exact chart before price broke out few days ago, take a look.
(Click on images to enlarge)
This Daily Transportation chart shows the opposite side of the bullish breakout – where price has broken the downward sloping resistance channel (drawn in RED) yet has not broken the most recent price peak level. Again, price MUST attempt to establish new price highs or lows based on Fibonacci price theory. Although a recent intermediate price peak has been broken, we would like to see technical confirmation that the major price peak is breached to confirm that the upside trend will extend further.

Yesterday, we sent an update that included the Weekly YM ADL predictions (below). We want to stress that as long as the ADL system is predicting much higher price targets and current price levels stay dramatically away from these predicted targets, we are seeing a “price anomaly” pattern setting up. We have seen many of these over the past few weeks and months. When these types of patterns setup, price usually breaks towards the predicted price levels VERY QUICKLY & VIOLENTLY (very much like what happened in early February with the dramatic price drop).
We believe the reason for this is that price should be nearer to the predicted ADL levels and, when the price anomaly pattern sets up, the external pricing factors that are preventing price from nearing the ADL levels is in control of price. As price finally breaks free of these external factors, price will attempt to “recover” towards the predicted price level and this move can sometimes be very quick (and profitable).
Be prepared over the next few weeks as we try to guide our followers towards some incredible profits. We are still waiting for technical confirmation of this breakout, but it should not be long now.
Our articles, Technical Trading Mastery book, and 3 Hour Trading Video Course are designed for both traders and investors to explore the tools and techniques that discretionary and algorithmic traders need to profit in today’s competitive markets. Created with the serious trader and investor in mind – whether beginner or professional – our approach will put you on the path to win. Understanding market structure, trend identification, cycle analysis, volatility, volume, when and when to trade, position management, and how to put it all together so that you have a winning edge.
Enjoy your weekend and be safe. This has been a great week and next week should be even better.
*********
Chris Vermeulen
email: chris@thetechnicaltraders.com
website: www.thetechnicaltraders.com
Disclaimer: This material should not be considered investment advice. Technical Traders Ltd. and its staff are not registered investment advisors. Under no circumstances should any content from this website, articles, videos, seminars or emails from Technical Traders Ltd. or its affiliates be used or interpreted as a recommendation to buy or sell any type of security or commodity contract. Our advice is not tailored to the needs of any subscriber we advise that you talk with your investment advisor before making trading decisions. This information is for educational purposes only.
As we close out this very successful week of trading, we wanted to provide some additional analysis and research regarding our belief for what next week holds. Before we get into the analysis for next week, lets take a bit of time to recap this week's success.
Our recent trade alerts, UGAZ, FAS, TECL, SIL and GDXJ have all been moving up quite well. UGAZ, FAS and TECL have been rocketing higher – as we predicted. Today, we closed our TECL position to lock in the 18.3% gains for our members with the intent to reenter with new trade opportunities as our strategies tell us. The single point of success for all of us is to manage our assets well in an attempt to achieve greater long-term success. We are still holding the other trades open for larger gains next week.
Now, onto our research and analysis. This Daily SPY chart shows us that price has already breached the recent price peak level – indicating that an attempt to push to new price highs should continue. Yet, the downward sloping resistance level (in YELLOW) is the current boundary for price and price has stalled at this level. This is to be expected after such a nice run upward and with price reaching this resistance level. We do expect price to advance much higher over the next few weeks, but we are also aware that price may rotate a bit near this level before attempting to breakout to the upside.
This week’s strong rally we warned was about to happen and showed this exact chart before price broke out few days ago, take a look.
(Click on images to enlarge)
This Daily Transportation chart shows the opposite side of the bullish breakout – where price has broken the downward sloping resistance channel (drawn in RED) yet has not broken the most recent price peak level. Again, price MUST attempt to establish new price highs or lows based on Fibonacci price theory. Although a recent intermediate price peak has been broken, we would like to see technical confirmation that the major price peak is breached to confirm that the upside trend will extend further.
Yesterday, we sent an update that included the Weekly YM ADL predictions (below). We want to stress that as long as the ADL system is predicting much higher price targets and current price levels stay dramatically away from these predicted targets, we are seeing a “price anomaly” pattern setting up. We have seen many of these over the past few weeks and months. When these types of patterns setup, price usually breaks towards the predicted price levels VERY QUICKLY & VIOLENTLY (very much like what happened in early February with the dramatic price drop).
We believe the reason for this is that price should be nearer to the predicted ADL levels and, when the price anomaly pattern sets up, the external pricing factors that are preventing price from nearing the ADL levels is in control of price. As price finally breaks free of these external factors, price will attempt to “recover” towards the predicted price level and this move can sometimes be very quick (and profitable).
Be prepared over the next few weeks as we try to guide our followers towards some incredible profits. We are still waiting for technical confirmation of this breakout, but it should not be long now.
Our articles, Technical Trading Mastery book, and 3 Hour Trading Video Course are designed for both traders and investors to explore the tools and techniques that discretionary and algorithmic traders need to profit in today’s competitive markets. Created with the serious trader and investor in mind – whether beginner or professional – our approach will put you on the path to win. Understanding market structure, trend identification, cycle analysis, volatility, volume, when and when to trade, position management, and how to put it all together so that you have a winning edge.
Enjoy your weekend and be safe. This has been a great week and next week should be even better.
*********
Chris Vermeulen
email: chris@thetechnicaltraders.com
website: www.thetechnicaltraders.com
Disclaimer: This material should not be considered investment advice. Technical Traders Ltd. and its staff are not registered investment advisors. Under no circumstances should any content from this website, articles, videos, seminars or emails from Technical Traders Ltd. or its affiliates be used or interpreted as a recommendation to buy or sell any type of security or commodity contract. Our advice is not tailored to the needs of any subscriber we advise that you talk with your investment advisor before making trading decisions. This information is for educational purposes only.
share
share
share
share
share

Chris Vermeulen has been involved in the markets since 1997 and is the founder of Technical Traders Ltd. He is an internationally recognized technical analyst, trader, and is the author of the book: 7 Steps to Win With Logic
Through years of research, trading and helping individual traders around the world. He learned that many traders have great trading ideas, but they lack one thing, they struggle to execute trades in a systematic way for consistent results. Chris helps educate traders with a three-hour video course that can change your trading results for the better.
His mission is to help his clients boost their trading performance while reducing market exposure and portfolio volatility.
He is a regular speaker on HoweStreet.com, and the FinancialSurvivorNetwork radio shows. Chris was also featured on the cover of AmalgaTrader Magazine, and contributes articles to several financial hubs like MoneyShow.com.
More from Silver Phoenix 500


