Stocks Get Closer To All-Time High, As S&P500 Trades Above 2100 Mark - Will It Continue Higher?
 share
share
 share
share
 share
share
 share
share
 share
share
In our opinion, speculative short positions are favored (with stop-loss at 2140…and S&P500 Index profit target at 2000).
Our intraday outlook is bearish, and our short-term outlook is bearish. Our medium-term outlook remains bearish as the S&P500 index extends its lower highs, lower lows sequence:
Intraday outlook (next 24 hours): bearish
Short-term outlook (next 1-2 weeks): bearish
Medium-term outlook (next 1-3 months): bearish
Long-term outlook (next year): neutral
The main US stock market indexes gained 0.2-0.4% on Wednesday, slightly extending their short-term uptrend, as investors' sentiment remained bullish. The S&P500 index continues to trade along the level of 2100. The nearest important resistance level is at 2110-2120, marked by April's local high. The next resistance level is at around 2130, marked by last year's all-time high of 2134.72. On the other hand, support level is at 2100, marked by previous level of resistance. The next important support level is at around 2070-2085. Last year's highs along the level of 2100 continue to act as medium-term resistance level. Will the market break above these medium-term highs and continue its seven-year long bull market?

Expectations before the opening of today's trading session are negative, with index futures currently down 0.2-0.4%. The European stock market indexes have lost 0.9-1.3% so far. Investors will now wait for some economic data announcements: Initial Claims at 8:30 a.m., Wholesale Inventories number at 10:00 a.m. The S&P500 futures contract trades within an intraday downtrend, as it retraces its yesterday's move up. The nearest important level of resistance remains at around 2115-2120. On the other hand, support level is at 2100-2105, among others. There have been no confirmed negative signals so far. However, we can see some short-term overbought conditions:

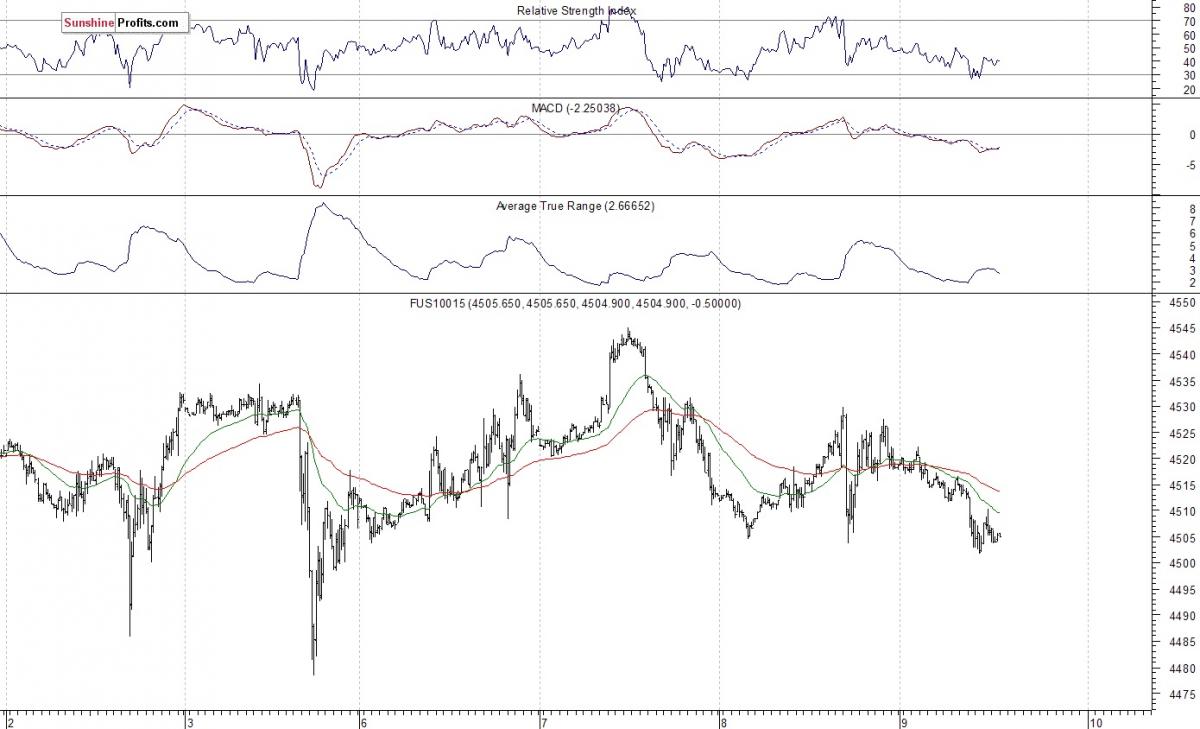
The technology Nasdaq 100 futures contract follows a similar path, as it retraces its yesterday's advance. The nearest important support level is at around 4500, and resistance level remains at 4530-4550, marked by recent local highs. The market extends its short-term consolidation following May rally, as we can see on the 15-minute chart:
Concluding, the broad stock market slightly extended its short-term uptrend on Wednesday, as the S&P500 index got closer to its last year's all-time high of 2134.72. There have been no confirmed negative signals so far. However, we can see technical overbought conditions that may lead to uptrend's reversal or downward correction. Therefore, we continue to maintain our speculative short position (opened at 2093.94 - last Wednesday's opening price of the S&P500 index). Stop-loss level is at 2140 and potential profit target is at 2000 (S&P500 index). You can trade S&P500 index using futures contracts (S&P500 futures contract - SP, E-mini S&P500 futures contract - ES) or an ETF like the SPDR S&P500 ETF - SPY. It is always important to set some exit price level in case some events cause the price to move in the unlikely direction. Having safety measures in place helps limit potential losses, while letting the gains grow.
share
share
share
share
share
More from Silver Phoenix 500


