Technical Analysis Of The Markets
 share
share
 share
share
 share
share
 share
share
 share
share
Current Position of the Market
SPX Long-Term Trend: A lengthy correction is most likely underway!
SPX Intermediate trend: Overhead resistance appears to have prevailed and turned prices short of making a new high.
Analysis of the short-term trend is done on a daily basis with the help of hourly charts. It is an important adjunct to the analysis of daily and weekly charts which discuss longer market trends.
OVERHEAD RESISTANCE PREVAILS
Market Overview
Last week, after literally creeping up past all former rally peaks since the all-time high of 2135, and showing negative divergence on the MACD (6-13-9) on every time frame from monthly to hourly, SPX could go no higher than 2120.55 and started to decline. In two days, it shed 30 points before rallying 6 points on Friday. Because of the divergence appearing in all trends from long-term to short-term, this index -- which has been the only major one to make a new high since mid-April -- may be sending the bulls a warning that they should not disregard.
Of course, this is only a warning at this time, and it will take much more confirmation than a 30-point decline to convince us that we have started an important correction. The first thing that the index needs to do in order to make this warning more urgent will be to decline below 2085, and subsequently 2026. Similar weakness must also appear in all other major indexes; this is what we should look for.
We also know that on Wednesday, oil (which had moved pretty much in lock-step with SPX) peaked and started to correct exactly at the same time. Will the market and oil continue these highly correlated moves in the future? Actually, the coincidence only started on 2/11. Historically, this has not been the case, so we should not continue to analyze the market based on oil price movements alone, although the correlation could continue for some time.
Of more importance, TLT has started to move out of a 4-month consolidation pattern -- which started on 2/11 -- and appears to be resuming its long-term uptrend and taking aim at its all-time high of January 2015. The resumption of buying in TLT should definitely be factored into our analysis of the market trend.
Finally, this could be only cautious profit-taking ahead of BREXIT, with voting scheduled for 6/26.
SPX Chart Analysis (These charts and others are courtesy of QCharts.com.)
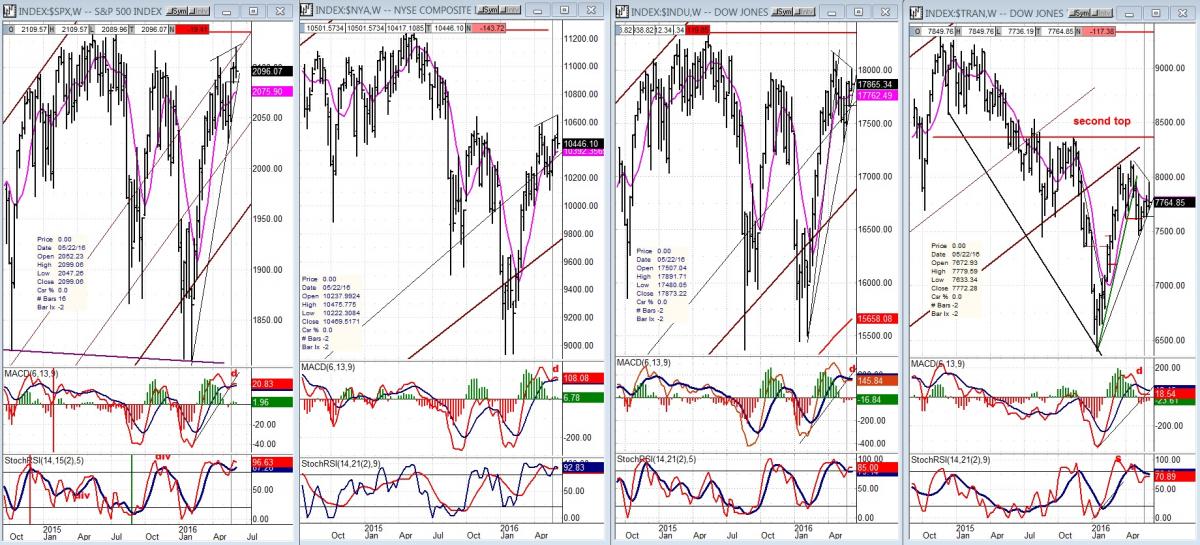
In the light of what was discussed above, perhaps we should start our analysis by comparing the relative positions of some major indices to see how their technical positions compare to one another. The weekly charts are best suited for this purpose. The relative weakness of the NYA to the SPX and of the TRAN to the DJIA is severe and their overbought and diverging oscillators which appear to be topping on an intermediate basis do not promise improvement anytime soon. If the weakest start to pull down the strongest, we could soon be in an important downtrend.
Daily Chart
When we look at the following chart, two things become immediately apparent. Firstly, the uptrend which started on 2/11 at 1810 is still intact! It is still contained within the black up-channel. But, it is also very obvious that this uptrend is undergoing a strong deceleration process, which threatens to reverse it, and that this reversal may have started last week. If we look at the oscillators at the bottom of the chart, we can see that all three have turned down, making bearish crosses, with strong downside momentum in the lower two which suggests that the reversal is just beginning. Moreover, the MACD turned after exhibiting some negative divergence.
On the daily chart, only a minor uptrend line has been broken. The decline will become more serious if the index starts to trade below 2085 and outside of its black channel; and outright bearish if we see it continue beyond 2026, which is where the last correction stopped, right on the 200-DMA. I use Fibonacci numbers for my MAs, so this is actually a 233-DMA.
We know from looking at a longer-term chart that since May 2115, SPX has traded in a wide range from the low 1800s to 2135. It looks as if the band of resistance shown at the top was again too much to overcome -- at least for now. First, it created deceleration, and now a potential reversal which could either be only the beginning of a short-term consolidation before moving to a new high, or a longer-term consolidation which will find support, once again, on the MA. We could even contemplate the possibility of another retracement to the low 1800s. With this potential correction beginning with negative divergence in all time frames, starting with the monthly chart, I tend to favor something more than just a short-term correction, but we’ll let more data accumulate before jumping to premature conclusions.

Hourly Chart
The trend lines drawn on the hourly chart are consistent with those of the daily chart. The top dashed line is a parallel to the intermediate black channel line and is positioned at the lower third of the channel. The fact that the extension of the rally from 1810 could never get past that line was already a sign that the entire rally was struggling to retain its uptrend. Last week, the oscillators started to decline ahead of the 1120 top (which was the completion of a P&F projection) with strong negative divergence showing.
On Thursday, the index gapped down and subsequently tried to fill the gap, but was not able to do it completely by the close – another sign of weakness! A much wider gap formed at Friday’s opening and there was no attempt to fill it, this time. The initial decline came 5 points short of testing the first important support level of 2085. If that one goes, so will, most likely, the black channel line. But this may not take place immediately. By Friday’s close, short-term traders were already taking advantage of an oversold index which had filled a minor projection. If we re-test that level on Monday and it holds, we will be setting up for our first counter-trend rally. Now that the daily indicators have turned down, and until they make a better showing, we have to assume that a short-term correction has started. Let’s monitor it and see where it goes from here.

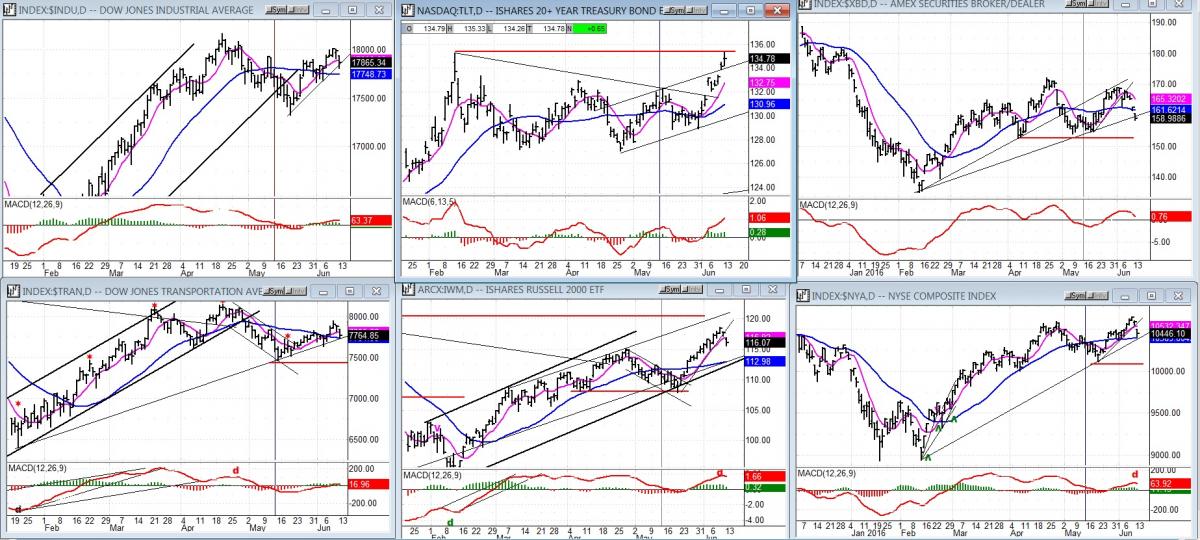
SPX et al… (Daily)
In this group, I have replaced the SPX chart by that of TLT. That index has just broken out of a 4-month consolidation which started when SPX began to rally from 1810, on 2/11. It’s probably not a coincidence that TLT is breaking out as the SPX appears to be ending its rally. It’s also worth noting that XBD, another reputable market leader, suffered strong selling in the past two days.
Elsewhere in this group, the TRAN Index continues to diverge sharply from DJIA. Also, the NYA sold off sharply. IWM continued to be the bullish exception. However, we should remember that along with TRAN, it had until recently been the weakest member of the group. It will have to prove that this is more than an oversold rally.
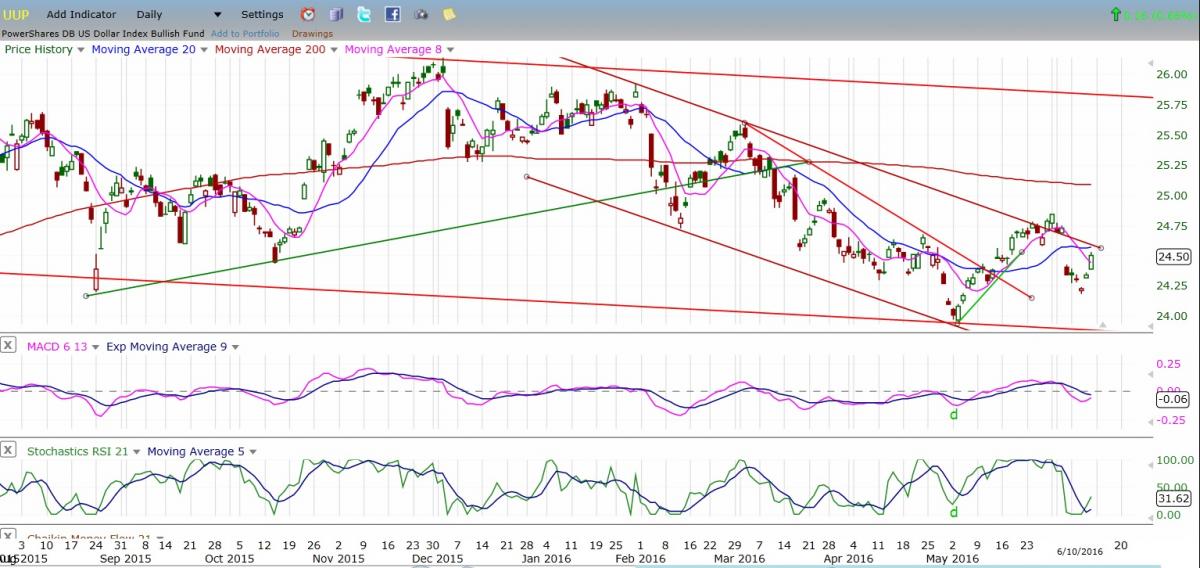
UUP (Dollar ETF)
After selling off sharply after a poor jobs report, UUP held well above its former low…and has shown a resurgence of buying. It is coming up to its downtrend line -- and will have to show that is has developed enough short-term buying momentum to drive upward through it.
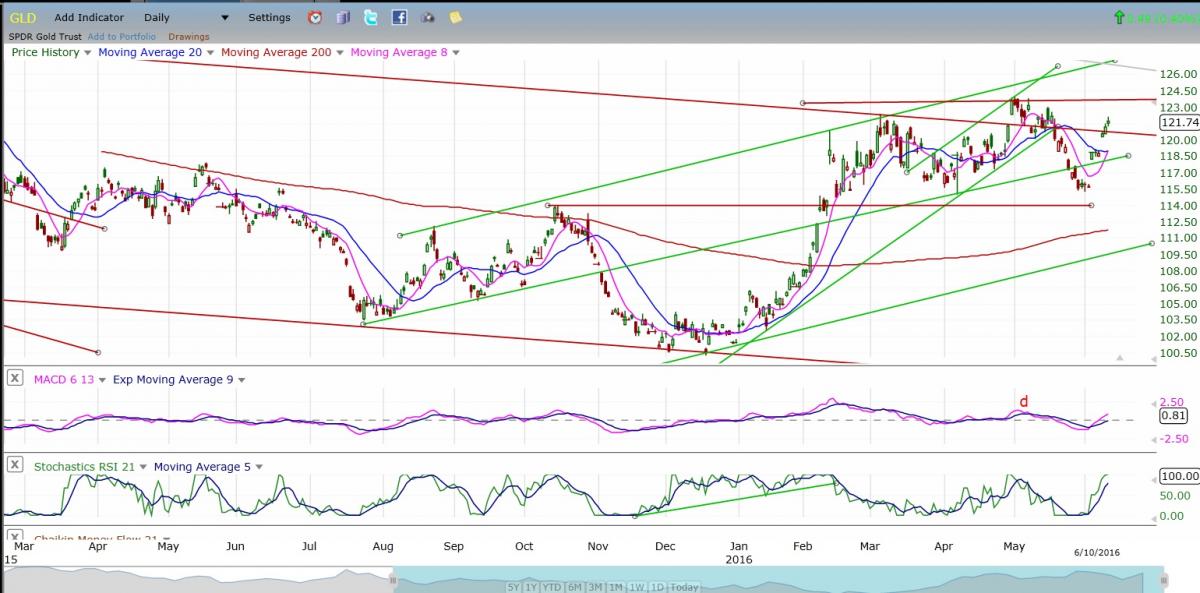
GLD (Gold ETF)
GLD held its former short-term low and rallied sharply along with the entire PM group. It is still well below its former short-term high, but its indicators show no sign of losing its upside momentum. It is trying to rise above its top resistance line one more time, but we’ll wait and see if it is able to get past its former recovery high.
USO (US Oil Trust)
To be sure the USO is perfectly following the script that had been written for it. It filled its gap, ran into resistance where it should have…then backed off. There is every reason to believe this should lead to more consolidation, but just how much is still unclear. It has closed outside of a short-term trend line and may eventually go on to challenge the more important (red) one below.

Summary
After showing some negative divergence from long-term to near-term time frames, at the same time that it met a P&F projection, SPX had a two-day, 30-point decline which could be the start of a more important correction. However, confirmation will be needed to show that this is not simply a cautious, short-term reaction to BREXIT.
In spite of some short-term negative technical developments, we’ll need to wait until the BREXIT Referendum…and analyze the market action over the next two weeks before making bearish pronouncements.
********
FREE TRIAL SUBSCRIPTON
Market Turning Points is an uncommonly dependable, reasonably priced service providing intra-day market updates, a daily Market Summary, and detailed weekend reports. It is ideally suited to traders, but it can also be valuable to investors since highly accurate longer-term price projections are provided using Point & Figure analysis and Fibonacci projections. Best-time reversal estimates are obtained from cycle analysis.
For a FREE 4-week trial, send an email toFor further subscription options, payment plans, weekly newsletters, and for general information, I encourage you to visit my website at www.marketurningpoints.com. By clicking on "Free Newsletter" you can get a preview of the latest newsletter which is normally posted on Sunday afternoon (unless it happens to be a 3-day weekend in which case it could be posted on Monday).
The above comments and those made in the daily updates and the Market Summary about the financial markets are based purely on what I consider to be sound technical analysis principles. They represent my own opinion and are not meant to be construed as trading or investment advice, but are offered as an analytical point f view which might be of interest to those who follow stock market cycles and technical analysis.
share
share
share
share
share

When Andre Gratian was a stock broker years ago, a friend introduced him to technical analysis of the market. Consequently, it is not an exaggeration to say that Andre fell in love with this approach! Ever since then, it has become an increasingly important part of his professional life. Gratian has studied the works of Wyckoff, Edwards & Magee, Edward J. Dewey (cycles) and many others. However, one of my most profitable undertaking has probably been to study Point & Figure charting, which he finds invaluable in analyzing stocks and indices. If he were restricted to one methodology, this is the one that he would choose. This well-rounded background has given him what he feels to be a special insight into the stock market, facilitating the recognition of meaningful patterns and the ‘turning points’ in all trends, whether they be short or long term. Andre feels very comfortable discussing the stock market and passing on meaningful information to others. His subscribers include individuals and money managers throughout the world. Moreover, his Newsletters are currently published on several financial sites, here and abroad.
More from Silver Phoenix 500


