Technical Commodity Charts for Gold, Silver, Oil, Gas & Stocks
 share
share
 share
share
 share
share
 share
share
 share
share
Commodities took a breather last week, while stocks slowly continued their march higher. This week (Monday) commodities moved lower with profit taking and fears of a much larger precious metals and broad market sell off being anticipated in the near future. While it sure looks like we are ready for a pullback in entire market we just may not get one for some time. We could get higher prices for 2-6 weeks still.
Everyone is anticipating a market correction, which is identical to what everyone thought back in March, yet prices continued to rise for two more months (June). I am anticipating a sharp 1-3 day pullback but that is just what happens during rallies. Sellers are quickly met with buyers and the rally continues.
Take a looks at the index DIA back in April and May, you see sharp pull backs then big bounces higher. I think we are at this point now. Also small cap stocks are still holding up better than large cap stocks. This is important because I look at small cap stocks as a leading indicator for the broad market.
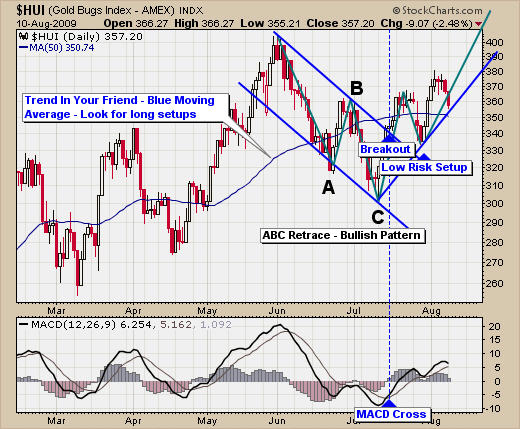
HUI - Gold Stocks Index - Daily Chart
Gold stocks have been on a buy signal since the middle of July and are currently testing our support trend line. Let's see if prices hold up this week. I do expect to see this trend line penetrated but with any luck it will be an intraday dip in price.
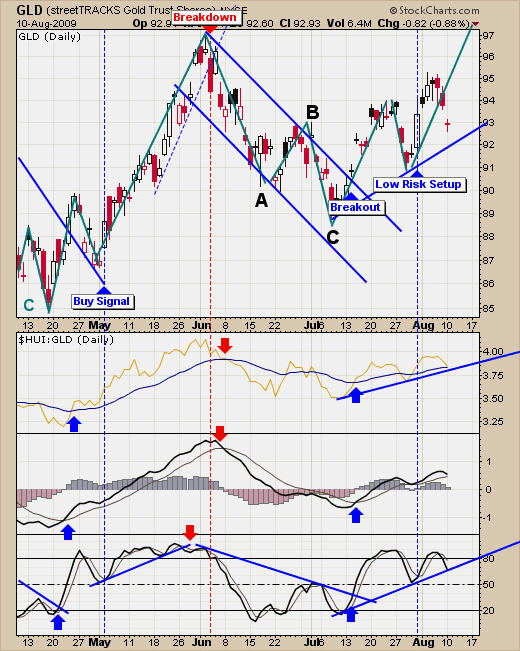
GLD ETF - Gold Bullion - Daily Chart
Gold is pulling back as also. We want to see prices reverse back up without our trend line support level penetrated.
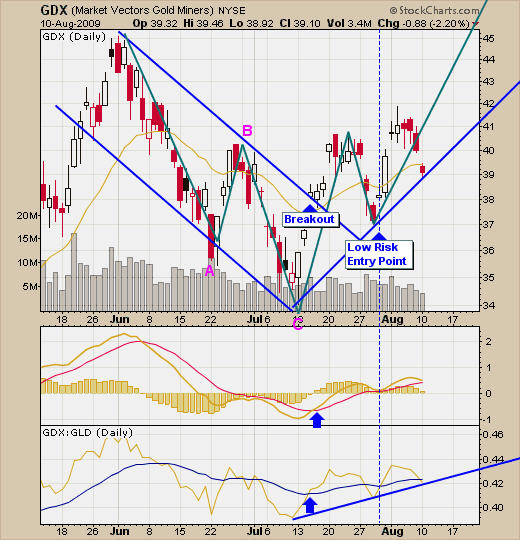
GDX ETF - Gold Miner Stocks Fund - Daily Chart
Gold mining stocks sold down today and are testing support. Let's watch and see what happens. We will be either taking out of our position for a small gain or get a bounce tomorrow.
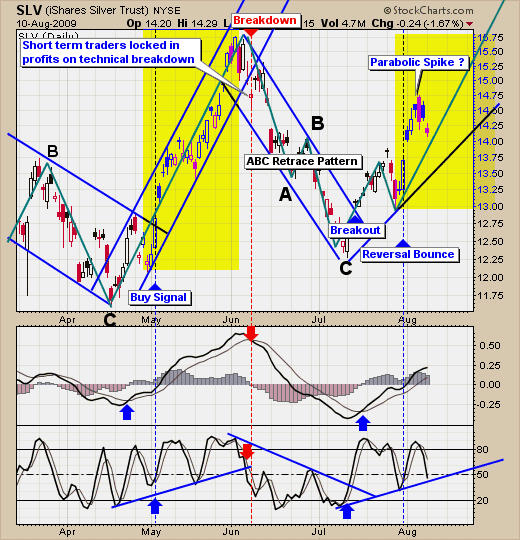
SLV ETF - Silver Bullion Fund - Daily Chart
Prices are still way over the support trend line so a deeper correction could be just a around the corner still. This type of price action today could be a "shake" to get traders out of their positions before prices rally again. Shake-Out's happen all the time and very easy to see on small cap stocks intraday as well. This will be explained my trading report in a few weeks.
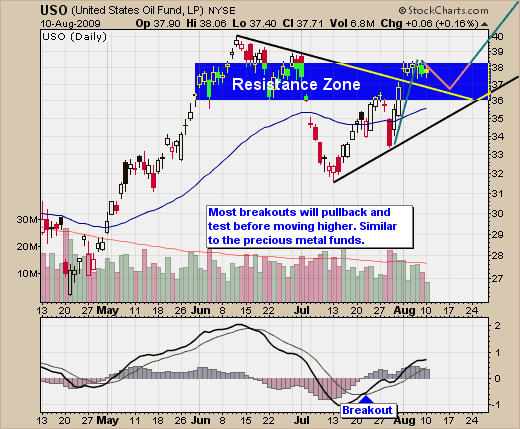
USO ETF - Crude Oil Prices - Daily Chart
Crude oil broke out last week and is now taking a breather as it moves sideways. Oil could quickly go either direction from here. Could be a double top in crude oil prices or it could be a large bull flag which points to much higher prices. We continue to watch as it unfolds.
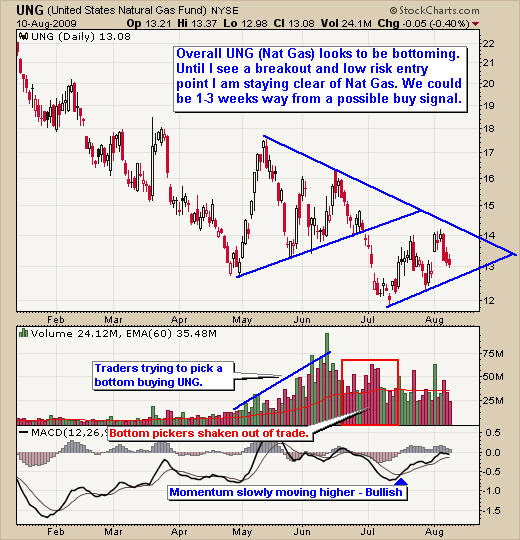
UNG - Natural Gas - Daily Chart
Natural gas is not to exciting at this time. It still needs 1-3 week of price action before I will be looking to enter into a position.
Commodity Trading Conclusion
Overall the entire market is unstable. The US dollar looks ready for a big bounce or a big breakdown, same with Precious Metals, Oil and the broad market. Times like this become very difficult to trade because so many investments are at extremes. They are either way over bought or way over sold. I have really tightened up on my trading in the past 2 weeks because of this situation. My position sizes are small and I am taking profits quickly. Until we get some type of pullback/profit taking in the market I do not feel comfortable putting much money to work. I think this is how most traders are feeling right now.
I would not clear the slate and sit in cash though, as I mentioned at the beginning of the report we could see prices claw their way higher for some time.
If you would like to receive my Free Weekly ETF Trading Report visit: www.GoldAndOilGuy.com
Or if you would like my Free Weekly Stock Trading Report visit: www.ActiveTradingPartners.com
share
share
share
share
share

Chris Vermeulen has been involved in the markets since 1997 and is the founder of Technical Traders Ltd. He is an internationally recognized technical analyst, trader, and is the author of the book: 7 Steps to Win With Logic
Through years of research, trading and helping individual traders around the world. He learned that many traders have great trading ideas, but they lack one thing, they struggle to execute trades in a systematic way for consistent results. Chris helps educate traders with a three-hour video course that can change your trading results for the better.
His mission is to help his clients boost their trading performance while reducing market exposure and portfolio volatility.
He is a regular speaker on HoweStreet.com, and the FinancialSurvivorNetwork radio shows. Chris was also featured on the cover of AmalgaTrader Magazine, and contributes articles to several financial hubs like MoneyShow.com.
More from Silver Phoenix 500


