Time Running Out On Silver Bear
 share
share
 share
share
 share
share
 share
share
 share
share
 For over the last 3 years, TPTB have been throwing everything including the kitchen sink at gold and silver to suppress the price. They've done a great job, i must admit - but ultimately, they will find their endeavor to suppress "real money" as futile as attempting to swim a beach ball to the bottom of a pool.
In the meantime, they can still get away with overwhelming the buy-side futures market with naked short positions because "investment demand" and sentiment are at historically rock-bottom levels, as would be expected during a protracted bottoming process.
But until proven otherwise - gold bottomed in June 2013! Gold has since twice tested the June 2013 low, in December 2013, and again at the beginning of this month - but each time gold has printed a sequentially "higher low", thus forming a bullish "triple bottom" reversal pattern. And until gold actually prints a "lower low", any talk of a trip down to $1,000 for gold is just that - "talk".
Of course, many precious metal bears point to the fact that, unlike gold - silver has indeed broken support and made lower lows - establishing a bearish "non-confirmation" of any gold bottom. What they aren't saying is that silver typically under-performs against gold in a bear market, and also lags in time making a final bottom.
For example, going back to the beginning of the secular bull market for gold and silver, as shown in the chart below - we see that gold bottomed at $253 in July, 1999. However, silver didn't bottom until 15 months later, at $4.50 in November, 2001.
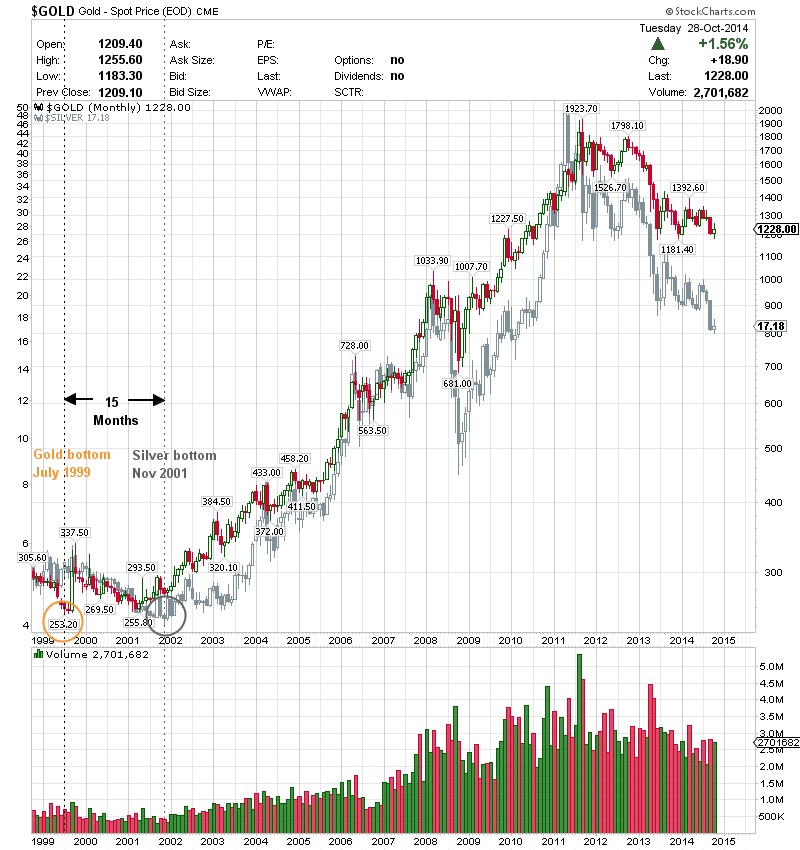
Returning to the present bear market, if we start with gold's bottom in June, 2013, then count 15 months from that point, we arrive at November, 2014, which is when - if history is any guide - we may anticipate the current silver bear market to end and for silver to begin its next leg higher within a secular bull market.
With the foregoing in mind, we can also look at the silver bear, in terms of time, from another perspective as well. For example, as is well known, market technicians place Fibonacci scales over price to anticipate retracement levels as well as bullish or bearish price targets. However, Fibonacci can also be used to measure time, and according to Senore Fibonacci, time is running out on the silver bear!
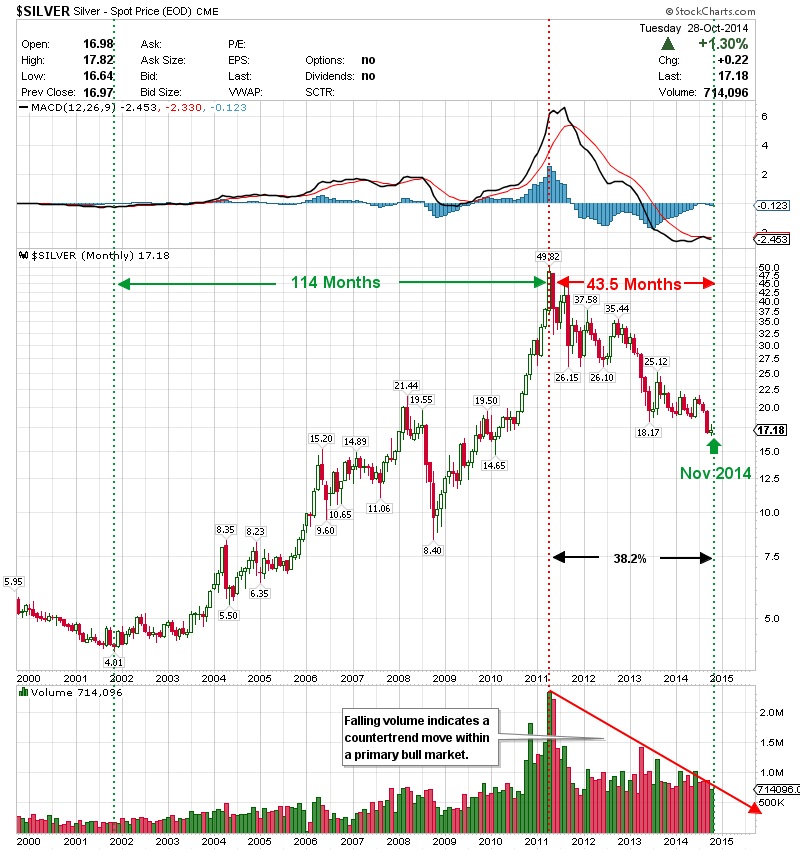
Starting with silver's November, 2001 bottom, silver went on a 114 month bull run to top out at $49.82 in April, 2011. Using Fibonacci to calculate 38.2% of silver's 114-month bull run, we get 43.5 months (114 x 38.2% = 43.5), which again - takes us to mid-November, 2014!
$SILVER - comex - Monthly
"When time is up, price will move." - W.D. Gann
Thus, we find that two different methods point to the same time frame - November, 2014 - as the time for the present silver bear market to end, and for silver to begin its next leg higher within its primary bull market.
Fortunately, we won't have to wait long to confirm this analysis as November is only days away! In any event, as long as gold holds support - once the silver bottom is in and can be seen in the rear view mirror, the next leg higher in the secular bull market for precious metals and mining companies should see investment demand awaken from its over 3-year slumber, and eventually swamp any manipulation attempts like a tsunami.
share
share
share
share
share
 Ruben Varela, Jr. is an independent trader specializing in the precious metals sector. Email: rtvarela@yahoo.com. The foregoing is for entertainment and educational purposes only and not investment advice. Please do your own research before investing.
More from Silver Phoenix 500


