Two Top Reasons Why Silver Is A Must-Have
 share
share
 share
share
 share
share
 share
share
 share
share
The timing of this silver rally relative to the Gold Silver Ratio (GSR).
In the last 100 years, there were three significant silver rallies with the current one still in progress. Below is a long-term Gold/Silver Ratio chart showing those silver rallies:
I have highlighted the periods during which the silver rallies occurred from bottom to peak.
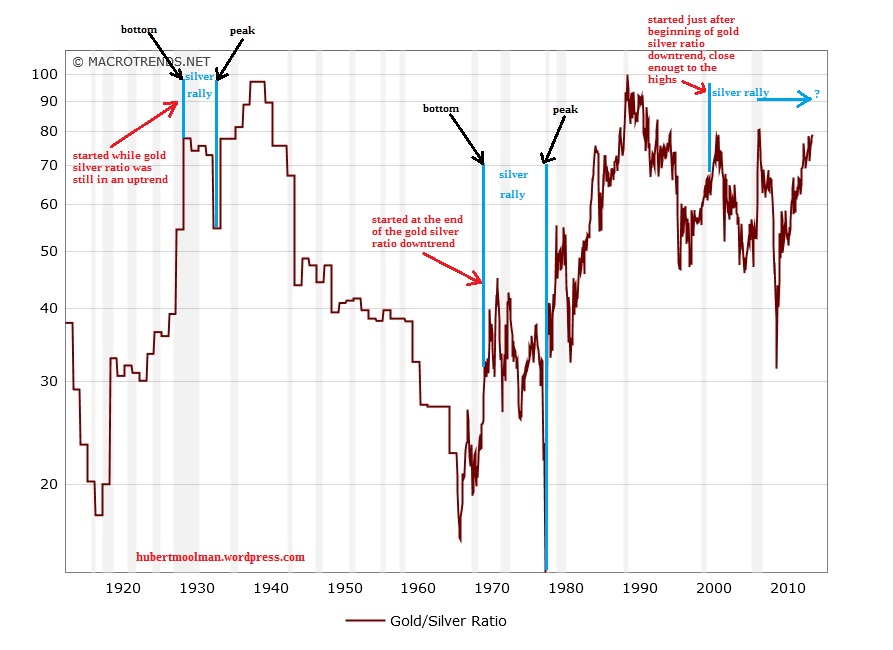
- The silver rally of the 30s started (measured from bottom) before the 1940s major peak of the GSR.
- The silver rally of the 70s started (measured from bottom) before the 1980 major bottom of the GSR.
- The current silver rally started (measured from bottom) after the 1991 major peak the GSR.
Although the three rallies have similarities, they are actually radically different, when you look at them relative to the GSR.
The 30s silver rally was not that strong because silver had not bottomed yet (from a long-term point of view), in relation to gold.
Although the rally of the 70s started during a down-trend in the GSR, it was right at the end of the downtrend, as well as closer to the lows than to the highs.
The current silver price rally seems to have started at a “sweet spot”. It started just after the beginning of the GSR downtrend, as well as close enough to the highs. This bull market, therefore, has much more energy available for a silver price rise as compared to the previous bull markets. It is much like how cycling downhill is easier than cycling uphill (just visualize it on the chart).
With the ratio even higher than when the silver bull market started; it is a really good time to exchange gold for silver. So, if you understand gold currently to be the ideal investment, then how much more silver?
Silver is probably the best insurance against consequences of the coming debt market collapse
Today's debt levels are massive compared to any previous era. These debt-levels are unsustainable, and we are headed for an inevitable debt collapse.
The US, for example, owes holders of US dollars (world-wide) about 114,771 tonnes of gold as at August 2015 (US monetary base/price of gold per ounce – read more). That is about 67% to 74% of world gold reserves, depending on which estimate one goes by.
There is no way that the US is able to obtain 67% of all world gold reserves. Even during its best years it was only able to claim a maximum of 22,000 tonnes of gold. Fortunately (for the US), the decree by Nixon in 1971 prevents US dollar holders to claim their gold from the US. Unfortunately (for the US), the decree will not stop the inevitable bankruptcy. That is the collapse of the US dollar and US bond (debt) market.
Fortunately, silver provides a perfect insurance against this coming debt collapse. This is because silver and debt (such as bonds) have historically moved in opposite directions. If silver is going up, then debt is going down and vice versa.
Below is a chart of interest on 10 – Year Treasury Bonds, since 1900 to prove this:
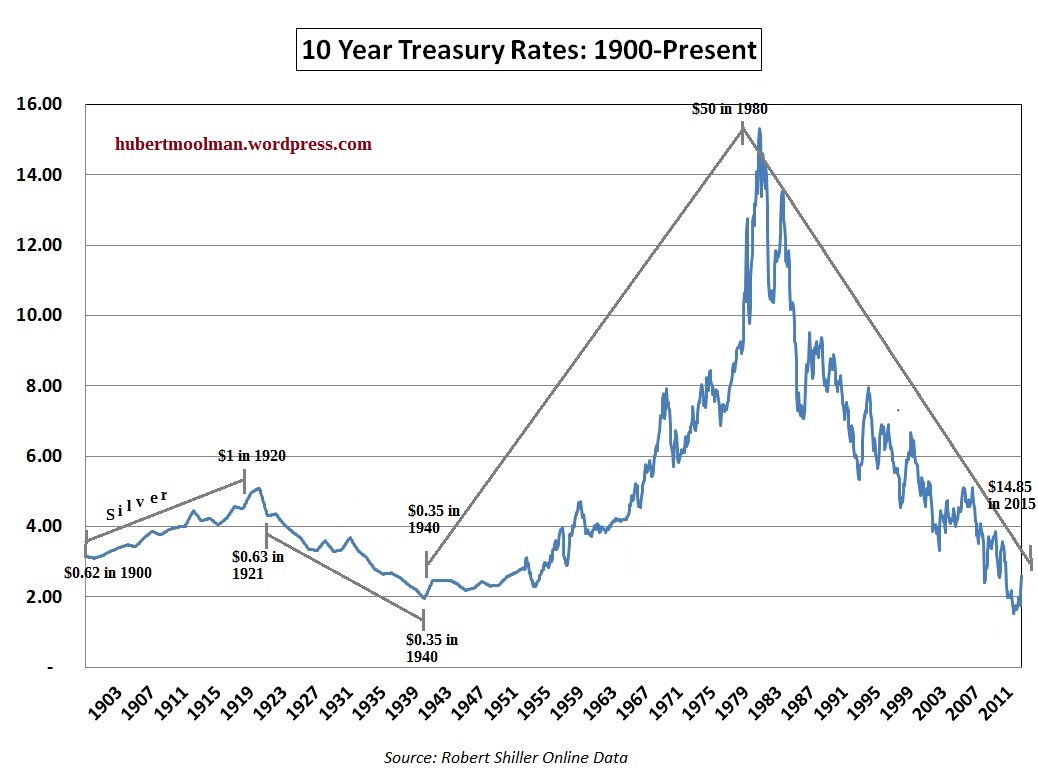
The blue is the actual interest rate movement, whereas, I have indicated (in grey) how the price of silver has moved almost in union with the interest rates over the long-term.
Alternatively (because the interest rate on a bond moves opposite to the price of the bond), when bonds are going up, then silver is going down, and vice versa.
The fallout from this debt collapse will be devastating – unlike anything seen before. Insurance like silver, against such a terrible and real threat is a must have.
********
For more of this kind of analysis, you are welcome to subscribe to my premium service. I have also recently completed a Long-term Silver Fractal Analysis Report .
share
share
share
share
share
More from Silver Phoenix 500


