Is VIX Beckoning The Bear?
 share
share
 share
share
 share
share
 share
share
 share
share
The FOMC issued guidance at its Wednesday policy meeting to the effect that interest rates would remain low into the foreseeable future. It further lowered the pace of its monthly asset purchases by $10 billion to $35 billion per month. The Fed also said it expects the unemployment rate to range between 6.0% and 6.1% for the rest of the year, which is slightly lower than its previous projection.
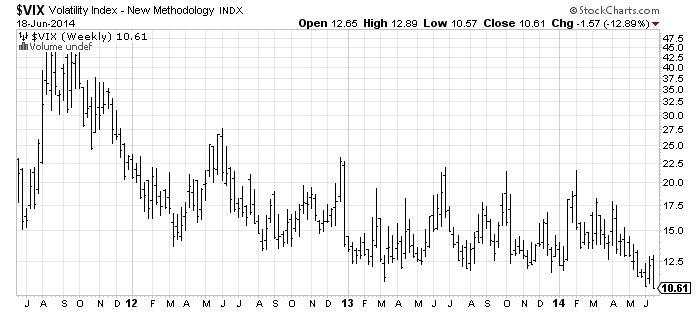
Aside from the new high in the S&P500, the other conspicuous milestone achieved today was the decline of the CBOE Volatility Index (VIX) to 10.60, a new low for the year. Market volatility also made headlines by falling to levels not seen since 2007.
Low volatility has been a double-edged sword for investors. It has undoubtedly helped soothe the nerves that characterized the last couple of years. Investors have been far less prone to panic at the appearance of bad news in recent months. The latest flare-up of tensions in Iraq and the subsequent spike in oil prices was essentially shrugged off by the stock market. That most certainly would not have been the case six-to-12 months ago.
Yet low volatility has a negative side as well. It often lulls investors into a false sense of complacency. The fact that the VIX is hitting its lowest levels in over seven years during summer, with its seasonal tendency toward low participation anyway, could prove to be a stumbling block for stocks in the near future.
Low volatility is already making life difficult for traders and fund managers who depend on a certain amount of volatility for trading opportunities. The Wall Street Journal recently published an article entitled, “Big Investors Lose Even as Markets Rise.” The article detailed the trading woes of some of Wall Street’s biggest investors, many of which have lost money in wrong-way bets in global markets. This is in spite of the fact that both stocks and bonds are in a well-established rising trend.
Famous fund manager Louis Bacon was down 5% this year through the end of May, partly attributable to the misreading of broad economic and financial trends. Paul Tudor Jones’ hedge fund is down 4.4% year to date. Alan Howard’s fund has also posted a YTD loss, according to WSJ. Jones joked at a recent investor conference, “I actually find myself daydreaming about winning ‘Dancing With the Stars’ on some days in the office. It’s gotten to be very difficult, when you depend on price movement to make a living, and there is none.”
According to the WSJ article, “An unusual period of calm has exacerbated problems for many trading strategies dependent on volatile markets.” The losses incurred by these investors have contributed to a trading slowdown hurting the largest investment banks. This underscores the fact that a certain amount of volatility is vital for the hedge fund industry, and a lack of volatility – even in the midst of a sustained bull market – can lead to diminished trading volumes and even losing investment strategies.
Options traders are aware that periods of extended low volatility usually set up volatility spikes down the line; that is, low volatility often precedes stock market declines. The relationship between low volatility and market tops isn’t firmly established, however, so there’s no way of predicting when a bull market will reverse based on volatility alone. Indeed, low volatility can sometimes persist for months or even years before eventually reversing. For instance, the last major reversal of low volatility occurred in 2007 after remaining near record lows for some two years.

Analysts who are predicting an imminent market crash or bear market based on the market’s low volatility factor are basing that guess on a slender thread of historical evidence. The fact remains that there is no way of predicting market turns in the immediate-term based on volatility alone. At best, the most we can conclude is that today’s low volatility will eventually, at some point in the future, give way to increased volatility. When that point will be is anyone’s guess.
Right now the market’s main trend remains up according to the interim trend index as well as the NYSE internal momentum indicators. The S&P500 remains above its rising 15-day moving average, showing that the immediate-term uptrend is still intact. The NYSE directional indicator (below) also remains bullish, showing the market’s short-term path of least resistance to also be up. Until these indicators reverse we can only assume that buyers still control the market and that bears will have to continue biding their time before making a stand.

********
High Probability Relative Strength Trading
Traders often ask what is the single best strategy to use for selecting stocks in bull and bear markets? Hands down, the best all-around strategy is a relative strength approach. With relative strength you can be assured that you’re buying (or selling, depending on the market climate) the stocks that insiders are trading in. The powerful tool of relative strength allows you to see which stocks and ETFs the “smart money” pros are buying and selling before they make their next major move.
Find out how to incorporate a relative strength strategy in your trading system in my latest book, High Probability Relative Strength Analysis. In it you’ll discover the best way to identify relative strength and profit from it while avoiding the volatility that comes with other systems of stock picking. Relative strength is probably the single most important, yet widely overlooked, strategies on Wall Street. This book explains to you in easy-to-understand terms all you need to know about it. The book is now available for sale at:
http://www.clifdroke.com/books/hprstrading.html
Order today to receive your autographed copy along with a free booklet on the best strategies for momentum trading. Also receive a FREE 1-month trial subscription to the Momentum Strategies Report newsletter.
Clif Droke is a recognized authority on relative strength and internal momentum, two valuable tools which have enabled him to call most major stock market turning points from 1997 through the present. He is the editor of the Momentum Strategies Report newsletter, published three times a week since 1997. He has also authored numerous top-selling books, including his most recent one, “High Probability Relative Strength Trading.” For more information visit www.clifdroke.com
share
share
share
share
share
More from Silver Phoenix 500


