What Is The Next Big Move In The Markets?
 share
share
 share
share
 share
share
 share
share
 share
share
Markets typically move in waves. For secular investors, the long waves with a duration of 6 months to 6 years are important. However, the 3 to 6 months waves convey information about the secular strength, and that is why we focus on the multi-month trends.
We believe that markets today are preparing for new trends. We rely on intermarket chart analysis to assess the highest probability moves, because intermarket dynamics sow the seeds for market specific trends.
Consider the key stock markets in the world. In the first chart set we look at the U.S. stock market (with the S&P500 as proxy for U.S. stocks), European stocks (the Euro Stoxx 600 as proxy for Europe), emerging market stocks and China. The trending moves (up or down) are highlighted with a blue frame. We will discuss the green ovals later.
Stocks in the U.S. trended in 2013 and 2014. Since December last year, however, U.S. stocks have moved sideways. Stocks in Europe had a strong trend higher when QE was announced by the ECB but that rally stalled in April. Emerging markets saw a strong move lower in Q2 2013 and a sharp rally mid-2014. Overall, however, emerging markets are going nowhere. China is clearly the market with the strongest current trend. The rally has been ongoing for 9 months.

Commodities show a totally different picture. We have selected the key segments, softs (cotton, coffee, sugar, etc), grains (wheat, corn, soybeans, etc), base metals and uranium. We excluded oil and natural gas as their trend between last summer and Q1 2015 is so well-known. Gold is not in the charts above but in the currency selection below.
 The strongest trends in commodities in the last 2.5 years took place in 2014, starting in April 2014 with softs and uranium, followed by grains and later by base metals.
Currencies have stabilized, after the monstrous rally of the U.S. dollar which started in August last year. Before and after the dollar rally, currencies had been trading mostly sideways, except for the Yen which almost collapsed at the end of 2012. Gold has moved sideways for 2 years, with short term rallies and corrections as indicated on the chart at the right.
The U.S. dollar rally and oil price collapse were the big stories of the second half of 2014 and Q1 2015. Interest rates, however, have been the strongest movers since then. The next chart shows the 10 year yield in the U.S. (left) and Germany (right), the key market in Europe. Interest rates are trending higher, which means that the market is anticipating an interest rate hike by the central bank(s).
So far, the increase in yields has resulted in a limited number of intermarket moves.Yield-sensitive stocks, such as utilities in the U.S., have corrected, which means they fell at least 10%. As a result, the broader stock indexes in the U.S. and Europe remain flat.
Commodities have not been moved by rising interest rates, probably for two reasons: first, with the absence of strong inflation expectations real rates are more or less stable (remember that commodities are inflation-sensitive), and second because of the already strong downtrend in most commodities in previous years (markets do not trend endlessly in one direction).
The different charts and intermarket dynamics show that a couple of strong trending moves take place each year, typically in a 3 to 6 month period. This year we have seen a strong move in yields and in Chinese stocks, apart from some insignificant rallies. We have highlighted the 2015 trends and rallies with the green ovals.
We believe this means strong moves are expected in the second half of 2015! But which markets?
That is the trillion dollar question. We see three scenarios.
First, there is a high probability that U.S. stocks are about to correct. They need a break after a strong 2-year move, appear toppy, and they also lack power. Moreover, the volatility index VIX is forming a descending triangle chart pattern. If volatility breaks out of this pattern we expect a correction in stocks.
Second, a stable commodity market seems likely, although commodities could see some snapback rallies. Given the sharp correction in most commodity segments in previous years, we do not anticipate stronger corrections. On the other hand, if inflation expectations increase, a sustained move higher is likely.
Third, a continuation of rising interest rates will take place if the U.S. Fed hikes rates, which it will if inflation increases. Remember the 2% inflation target? There is only a 0.3% inflation rate in the U.S. while Europe stands at a status quo. If central banks raise rates, it will take place in an inflationary environment, which is friendly to commodities, precious metals and stocks.
Gold is entering its strongest season. The months of July and August typically bring a short term rally in the precious metals complex. We will gauge the strength of any short term rally to evaluate its secular trend.
Precious metals miners should lead the metals, both higher and lower, as the miners are at a critical point, shown by the miners to gold ratio (see next chart). The precious metals complex is trading at long term structural support as miners have led the metals lower since 2011.
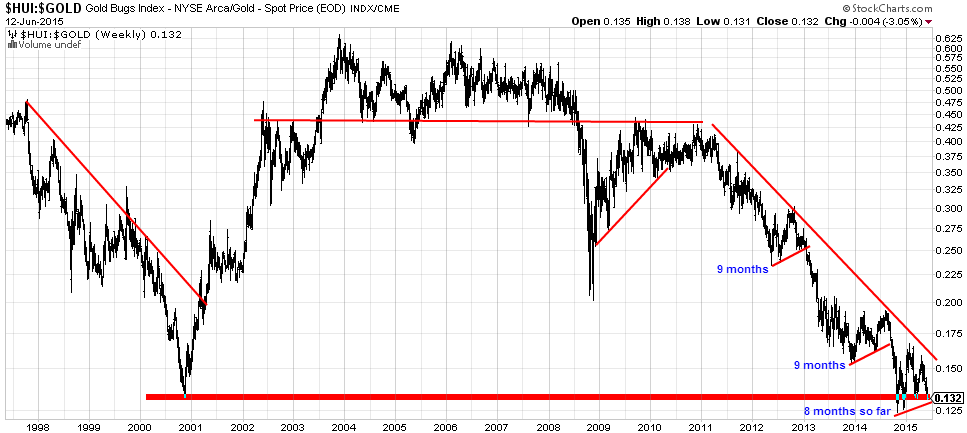
Typically, in the last several years, shorter term trends have lasted about 9 months. The next BIG move in miners and metals is about to take place. We will be assessing the strength of the summer rally, which will be indicative for the precious metals complex in 2015 and 2016.
Smart investors do not anticipate a particular move, they prepare themselves for what is likely to happen.
********
Check the latest Gold & Silver Report
share
share
share
share
share
More from Silver Phoenix 500


