Stock Market Is About Ready To Plunge!
 share
share
 share
share
 share
share
 share
share
 share
share
 Last time, I talked about there being one more rally left…and then the market would drop bigtime. I see no change in that outlook (after looking over the Gann Cycles from last Monday, I have determined that the next top would be April 2). I also talked about the false breaks on the rising wedges of various indices.
We are going to go over some of the charts in my last report ( https://www.gold-eagle.com/article/stock-market-process-forming-major-top ) , including the daily MACD, Chaiken’s Money Flow as well as silver. Yes, the reason I want to go over the weekly chart of silver, is to look at the some of the reasons why we are going to have huge swings of the markets over the next weeks, months and years. The problem is, we are dealing with deflation, but at the same time, countries are inflating their currencies like mad trying to head that threat off.
Also, we have the threat from the FED that they are going to raise rates in the not too distant future. We have a currency war going on. Silver is in an obvious downtrend in dollars, a secular bear market if you will. We have negative interest rates for the first time in history in Europe and the Japanese keep inflating their currency like there’s no tomorrow.
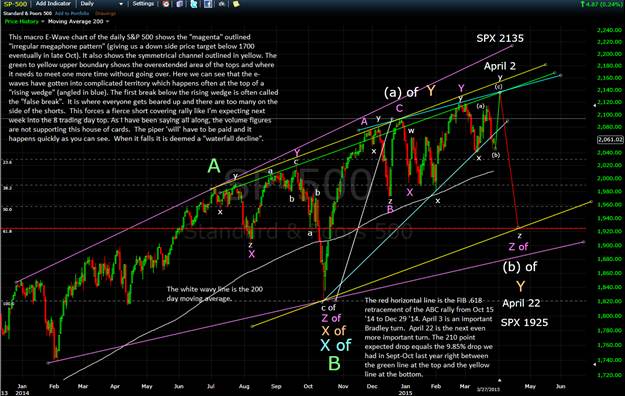
Precious metals go through an approximate 8 to 8.5 year cycle, low to low and that cycle is due in late 2016 to early 2017. You can see the signature moves in silver as they move with the stock market. There is a correlation, especially at this late stage of the game. The chart below goes back over some of my earlier articles on the Irregular Megaphone Pattern (outlined in magenta); the current trend channel in yellow; the rising wedge in blue; and it is replete with E-Wave denotations. It also goes over the next Bradley turn due April 3.
Keep in mind that I may change the E-Wave denotation going forward, especially dealing with the big WAVE A on the chart in green which may end up being the last a-b-c rally into December 29. Either way, it will have the same effect going forward, especially when I use the Bradley and astro signatures.
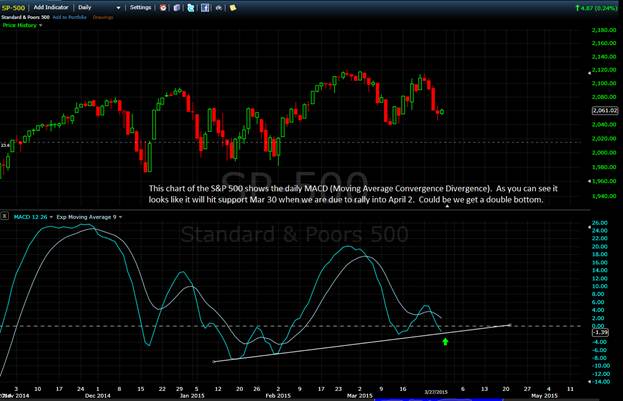
The next chart shows the daily S&P500 with the MACD. You can see we are nearing support Monday, which should increase the possibility that we see a move back above lower end of the rising wedge going into Tuesday (which should bring the shorts to cover as they are heavily short right now…another chart on this later.
The next chart shows shorts at the highest level since the October bottom:
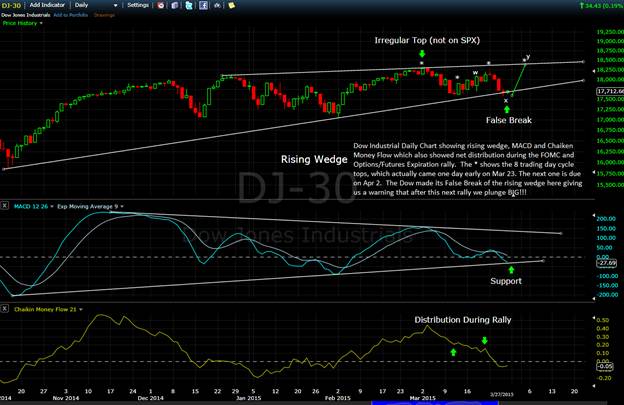
The next chart shows the Dow Industrial Average with daily MACD and Chaiken Money Flow, which showed net outflows during the week of the recent FOMC rally (no wonder I was confused!!).
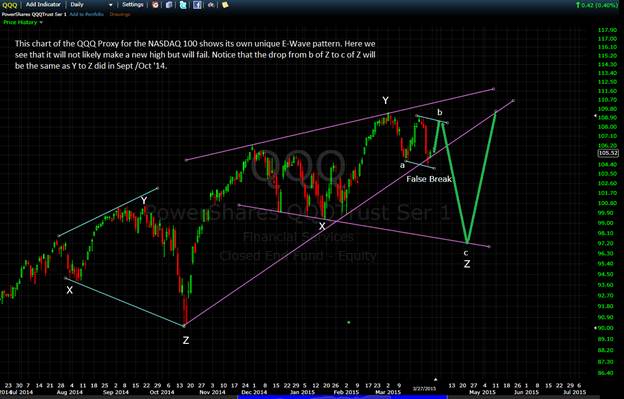
The next chart shows the NASDAQ 100 proxy QQQ and its outlook (it still could be that the QQQ makes a new high here, we’ll see).
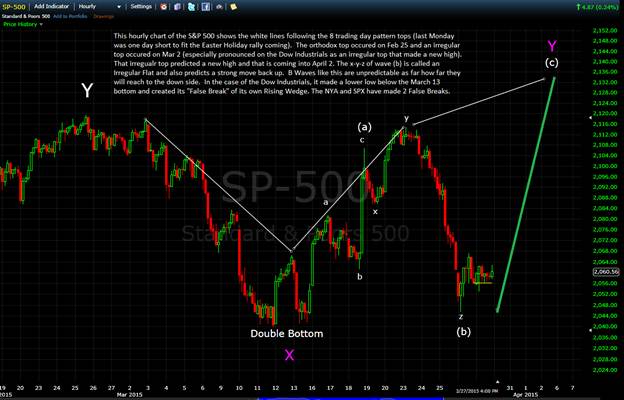
The next chart shows the hourly SPX500 and its e-wave denotation:
The last chart is the weekly silver chart:
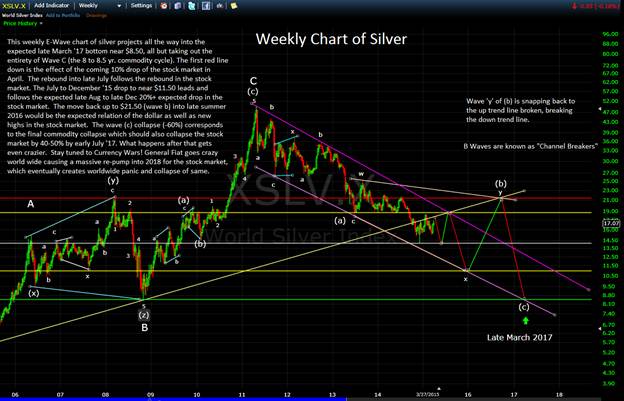
When you look at this likely projection, you can see what may happen in the future with the stock market and why. It all has to do with monetary stimulation or lack of vs. the other world currencies. To begin with, that wasn’t the case as silver and gold had gotten ahead price wise, and were due for a pull back. Now we are danger of deflation and that will be affecting the stock market.
Eventually, we will likely see massive inflation, which will likely derail the economies of the world and lead us into a massive collapse from 2018-2020. I have 2485 as the final top in the S&P500 in 2018. We are closer to a top than bottom. There is far more risk to the down side than reward on the upside. I believe we will see under 1700 in October this year, a new high in early fall 2016 and under 1500 by July 2017. I believe we will see 10-17% pull backs as being normal, with a 20% this year and perhaps another sharp pull back in the summer before rallying to new highs again and then falling hard.
As far as the astro is concerned, we have Sun trine Jupiter on April 2, which is like a bullish magnet; then comes Sun Sq. Pluto on April 5, and Sun Conj. Uranus on April 6 (the gruesome twosome), and a lunar eclipse on April 4 which is a signature of a major reversal (remember the solar eclipse of March 20?). The Bradley is due a turn on April 3 and the next Gann top is due on April 2. My next date for a low is April 8 (wave A), then a top on April 15 (Wave B) then the final low on April 22 (Wave C). Wave C is the capitulation wave, so get ready for some fireworks!
share
share
share
share
share
More from Silver Phoenix 500


