2015: The Year of Massive Market Volatility?


We continue to believe that one of the big themes to play out in the financial markets in 2015 will be increasing multi-asset class volatility.
Reasons to think this may be the case include: (1) the bullish chart technicals of the VIX suggest this Volatility Index may continue to set up for a “super spike”, (2) the current volatility playing out in the currency and commodity markets with the explosive moves in the U.S. dollar index and crude oil highlighting this dynamic, (3) the multi-decade directional correlations between commodities and equities that suggest stocks may soon slide into correction mode, and, (4) an ongoing rally in bonds that supports our repricing of risk thesis that may lead to a serious stock market sell-off.
Picking up on last week’s 5 Themes for 2015, it makes good sense to tackle the one dynamic that is likely to ripple through the other four themes and this is increasing multi-asset class volatility.
As suggested by that description, this sort of volatility may extend well beyond a severe equity market correction accompanied by a super spike in the VIX to include “unstable, unpredictable and explosive” moves in the currency, commodity and bond markets. In our view, we would contend that the potential for any corrective action in stocks will have begun with the building volatility in the currency and commodity markets over the last two years.
But before jumping too far ahead, allow us to make the case for massive market volatility based on chart analysis of the VIX, or the Volatility Index, and perhaps the most accepted way to gauge market volatility. Its charts continue to support our “super spike” contention made last June and one that was successful relative to our initial target with two additional targets outstanding.
 The first of the three super spike targets was exceeded last October ahead of the BOJ accomodation /intervention.
The second is setting up simply as an equal and opposte “boomerang” move back up to the top of the range near 48. It may be possible to achieve this level in the first half of 2015 potentially.
The third is the true super spike off of the bearish Falling Wedge in blue with a target of 90.
This Falling Wedge represents waning implied volatility and increasing complacency on the part of investors until it reverses into a “boomerang” of “equal opposite activity” as some level of selling activity and fear returns.
It was this very pattern that induced the last true super spike back in 2008/09 marked in grey and the same pattern in the 1990s that produced the multi-year spike higher starting in 1998. This clear pattern repetition provides us with a strong degree of conviction in the possibility that the current Falling Wedge will perform in a similar manner even if its precise target of 90 is not met exactly.
Put most simply and based on our chart analysis, we believe a possible scenario is that the VIX may spike up toward 50 in the first half of 2015 and may spike toward 90 in the second half of 2015 into 2016.
This contention is based purely on the chart technicals of the VIX as explained above with many fractals within the VIX supporting our belief and firming up our contention in the likelihood of a true super spike event setting up for near/medium-term in the VIX.
But this clearly says nothing about our claim around increasing multi-asset class volatility and so allow us to offer a current and very mainstream example through a shared chart of the U.S. dollar index and WTI crude. This multi-year, daily chart shows rather clearly “unstable, unpredictable and explosive” moves in each asset class in a way that offers a simpler way of expressing the fundamentals that have worked to drive crude’s collapse.
After spending years in defined but separate trading ranges, it seems apparent that the dollar’s explosive move higher is the inverse of crude oil’s truly unstable move to the downside and one that was fairly unpredictable considering that its range was more bullish in nature than bearish.
Importantly, this chart shows that the dollar index has climbed above the top of crude oil’s old trading range, or an area of resistance and historic selling pressure, as crude oil has dropped below the bottom of the dollar index’s old trading range and an area that has been supported by buyers in the past. This particular piece of analysis is somewhat new to us due to the fact that it is based on such extreme and skewed technicals that appear somewhat infrequently.
We tend to believe that this sort of a technical picture appears only around times of tremendous market upset that occurs around the beginnings and ends of bull markets. This is a polite way of saying that the massive volatility that has wracked the currency and commodity markets may soon show up in the even more widely watched equity markets.
This possibility shows up in the long-term weekly chart of the CRB Index, crude oil and the S&P 500 considering that previous periods of extreme sideways trading action led to massive moves up or down as marked.
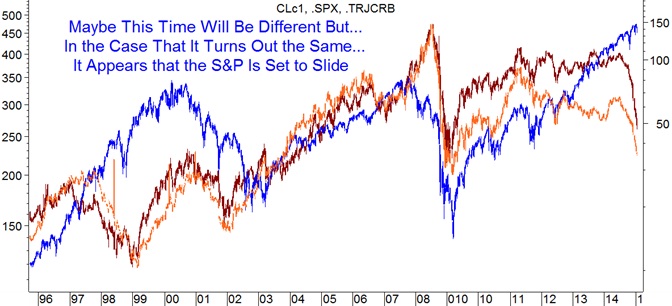
Without getting too nuanced about the rough directional correlations shown between these various risk assets, it is key to make note of the multi-decade sideways trading range that the CRB Index, crude oil and the S&P 500 have spent the better part of the last 20 years in.
Clearly, there have been exceptions both to the upside and downside on trading action that is extreme, in our view.
What is very important here is to make note of the fact that the volatility in the commodity markets has taken both the CRB Index and crude oil back down into that long-term range. Should the multi-decade correlation hold, this strongly suggests that the S&P 500 may, too, trade back down into that range to essentially erase the possibly extreme gains made above the range over the last two years and perhaps even much of the bull market.
In our opinion, there have been technical signals suggesting this possibility for many months now including the S&P 500 coming dangerously to breaching its bull market uptrend. It would be this sort of potential break in the uptrend and forces of accumulation that would offer a strong signal that the sort of volatility playing out in the currency and commodity markets may soon spread to the equity markets.
Supporting this bearish-for-stocks possibility is the massive volatility that has been playing out in the bond markets as well with the 10-year yeild moving as high as 3.01% on January 3, 2014 from 1.66% on May 2, 2013 and then back down to the current 1.77% according to data offered by the U.S. Department of the Treasury over the last two years.
As discussed last week, it has been this tremendous move down in yield on a possible flight-to-safety that has offered another strong indication that equities are likely to wracked by big volatility in the months to come as stocks potentially sell off on the repricing of risk dynamic discussed in that note.
Overall, then, there are several solid reasons to believe that 2015 may turn out to be the year of massive market volatility.
********
Greenbush Financial Group GFG Weekly Market Insight January 16, 2015
DISCLOSURE
Investment Advisory Services offered through Greenbush Financial Group, LLC. Greenbush Financial Group, LLC is a Registered Investment Advisor. Securities offered through American Portfolio Financial Services, Inc. (APFS). Member FINRA/SIPC. Greenbush Financial Group, LLC is not affiliated with APFS. APFS is not affiliated with any other named business entity. Abigail Doolittle is a registered representative with American Portfolio Financial Services, Inc. Information in this illustration has been obtained from sources believed to be reliable and are subject to change without notification. The information presented is provided for informational purposes only and not to be construed as a recommendation or solicitation. Investors must make their own determination as to the appropriateness of an investment or strategy based on their specific investment objectives, financial status, and risk tolerance. Past performance is not an indication of future results. Investments involve risk and the possible loss of principal. Any opinions expressed in this discussion are not opinions or views of American Portfolio Financial Services, Inc. (APFS) or Greenbush Financial Group, LLC. Options expressed are those of the writer only. There is no guarantee that a diversified portfolio will enhance overall returns or outperform a non-diversified portfolio. Diversification does not ensure against market risk. The opinions voiced in this material are for general information only and are not intended to provide specific advice or recommendations for any individual. To determine which investments may be appropriate for you, consult your financial advisor prior to investing. All performance referenced is historical and is no guarantee of future results. All indices are unmanaged and cannot be invested into directly.
More from Silver Phoenix 500


