Amount Of Leverage In The Silver Market


While many precious metals investors realize the massive amount of paper trading leverage taking place in the gold market, they should see what is going on in the silver market. In a previous article, I provided data showing that an amazing $9.8 trillion of notional gold paper trading took place on the world’s exchanges in 2016 versus $42 billion in actual physical gold investment. This was a paper to physical ratio of 233 to 1.
However, the amount of paper trading leverage in the silver market is much higher than that.
But, before I get into the specifics of the paper silver market trading leverage, let’s take a look at the pathetic amount of physical silver investment versus Central Bank asset purchases. According to the data in the recently released 2017 World Silver Survey, total physical silver investment for 2016 came in at a whopping $4.4 billion:

That’s correct. When we add up all the global silver investment demand last year, it adds up to a measly $4.4 billion. It was nearly ten times less than all physical gold investment in 2016. The analysts who wrote 2017 World Silver Survey, arrived at the $4.4 billion figure by using the following data:
Global Silver Investment 2016 (in million oz – Moz):
Physical Bar Investment = 83.6 Moz
Official Coins & Medals = 123.2 Moz
ETP (ETF) Inventory Build = 47 Moz
Grand Total Silver Investment = 253.8 Moz
By adding up total Physical Bar investment of 83.6 Moz, Official Coins & Medals of 123.2 Moz and ETP (ETF) Inventory Build of 47 Moz and then multiplying it by the average silver spot price of $17.14, it totaled $4.4 billion.
Even when the silver price reached a high of $49 in 2011, total global silver investment was only $6.6 billion. Looking over the market in the past six years, the total $32 billion of silver investment from 2011 to 2016 is nothing when we compare it to the staggering amount of Central Bank asset purchases. According to a recent Zerohedge article, Why “Nothing Matters”: Central Banks Have Bought A Record $1 Trillion In Assets In 2017:
A quick, if familiar, observation to start the day courtesy of Bank of America which in the latest overnight note from Michael Hartnett notes that central banks (ECB & BoJ) have bought $1 trillion of financial assets just in the first four months of 2017, which amounts to $3.6 trillion annualized, “the largest CB buying on record.”
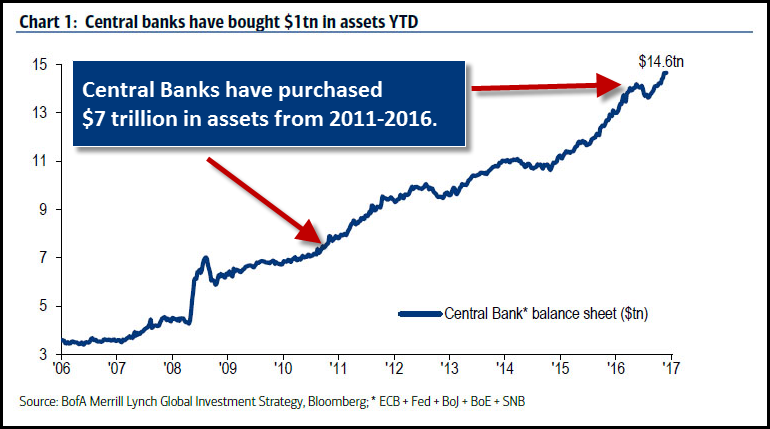
Now, if we look at the chart above, Central Banks purchased $7 trillion (that was made public, could be higher) from 2011 to 2016. If the Central Banks purchased $1 trillion in just the first foru months of 2017 versus the $7 trillion from 2011-2016, something seriously wrong must be going on in the markets.
Regardless, $7 trillion is a lot of money when we compare it to the pathetic $32 billion invested in silver over the same period. If we just took $100 billion of that $7 trillion and placed it in silver, it would have quadrupled the amount of global silver investment from $32 billion to $132 during that 2011-2016 time period. A quadrupling of silver investment demand, would have pushed the price of silver, WAY ABOVE the peak $50 price.
By the Central Banks propping up the STOCK, BOND and REAL ESTATE markets, the value of silver (or gold) is being severely depressed. And of course, to keep investors from finding out about SILVER’S HIGH QUALITY STORE OF VALUE, the price continues to be capped by the massive amount of paper trading leverage.
So, how much paper trading leverage is in the Silver Market? Let’s look at the following chart:
Again, according to the data put out by the 2017 World Silver Survey, total paper trading silver volume on the world’s exchanges was 159,000 Moz, or 159 billion oz in 2016. Thus, the exchanges traded 180 times more paper silver in 2016 than the global mine supply of 886 Moz.
If we look at the ratio of global notional paper silver traded last year compared to actual silver investment, it was more than double that of gold:
By multiplying the 159 billion ounces of paper silver traded in 2016 by the average spot price of $17.14, we arrive at a staggering $2.27 trillion of notional paper silver traded versus $4.4 billion actual silver investment. Thus, the paper notional silver trading ratio to physical silver investment was a whopping 517 to 1… double the 233/1 for gold.
Now, this 517/1 notional paper trading ratio to physical silver investment in 2016 does not take into account any of the huge OTC market where a lot of silver is traded and there are no quantifiable statistics to the amount or degree.
Currently, the crypto-currencies are experiencing huge gains over the past several months. It doesn’t matter if an individual agrees with owning Bitcoin or one of the many crypto-currencies, the important thing to understand is that the tremendous price increases in many crypto-currencies are likely due to concern to the massive amount of Central Bank $1 trillion in asset purchases in the first four months of the year.
Furthermore, crypto-currencies are a likely a GOOD INDICATOR of what will take place in the gold and silver market when investors realize most STOCKS, BONDS and REAL ESTATE values will continue to implode as the U.S. and Global Oil Industries disintegrate.
The gold and silver prices are being capped because paper contracts can be added as more funds move in. However, crpyto-currencies do not have this problem because the amount of Bitcoins, as an example, are limited.
Courtesy of SRSrocco Report.
More from Silver Phoenix 500


