The Anatomy Of The Young Stock Market Bull


After Thursday's late-day setback, stocks stabilized only to dip again in the runup to Trump's press conference – but what is the subsequent rebound made of? In today's flagship Stock Trading Alert, I'll examine the prospects of the bull run, and assess the bulls' strength. Can they power higher still?
S&P 500 in the Medium- and Short-Run
The month of May is over, so let’s start with the monthly chart perspective (charts courtesy of http://stockcharts.com ):
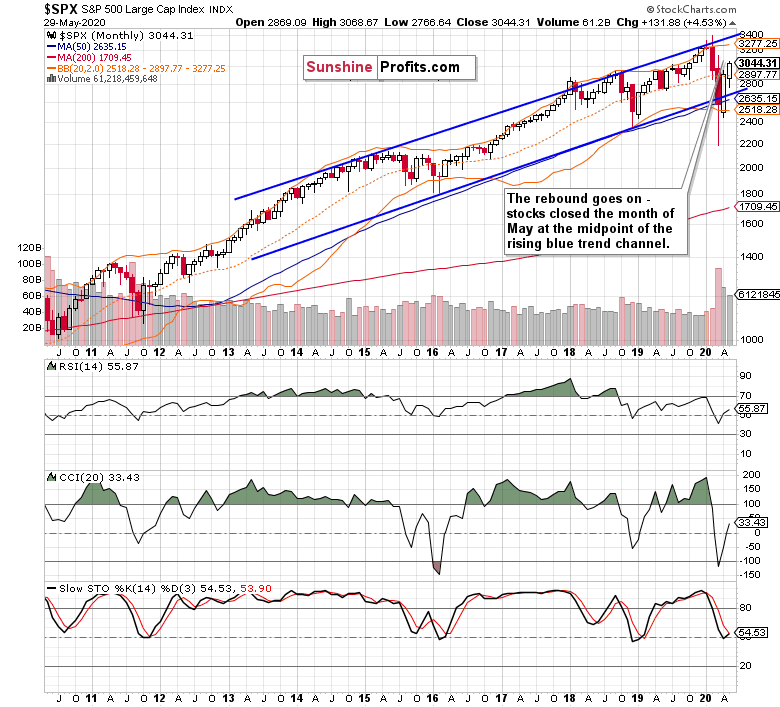
Quite a sharp rebound from an even sharper plunge – that would be a fitting first impression. After breaking below the lower border of the rising blue trend channel, stocks reverted to trade solidly back inside. Having reached the midpoint of the channel amid improving monthly indicators, can we look forward for more gains ahead?
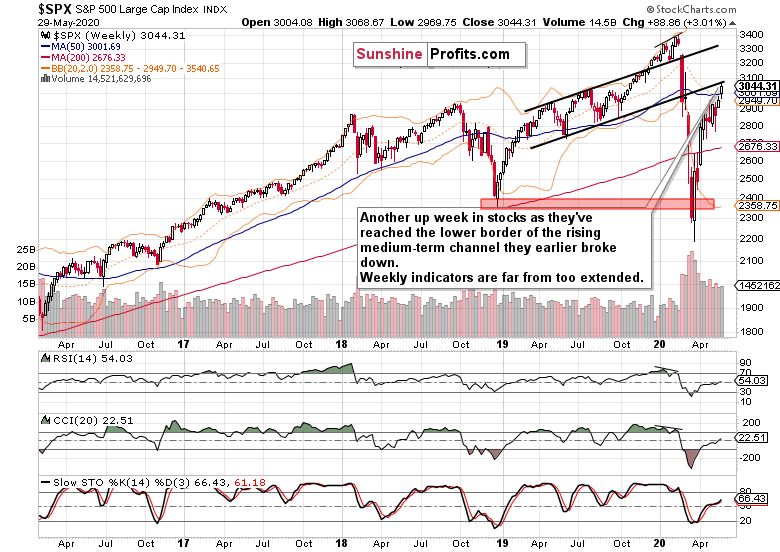
The weekly chart shows bullish price action that overcame another key resistance – the early March gap (shown in detail on the below daily chart). Breaching also the 50-week moving average, stocks have tested the lower border of the rising medium-term channel that they broke down from earlier.
While the weekly indicators are extended, they're not overly extended. Neither the volume reveals increasing involvement of the sellers. When will they show up to wage a decisive battle for lower prices?
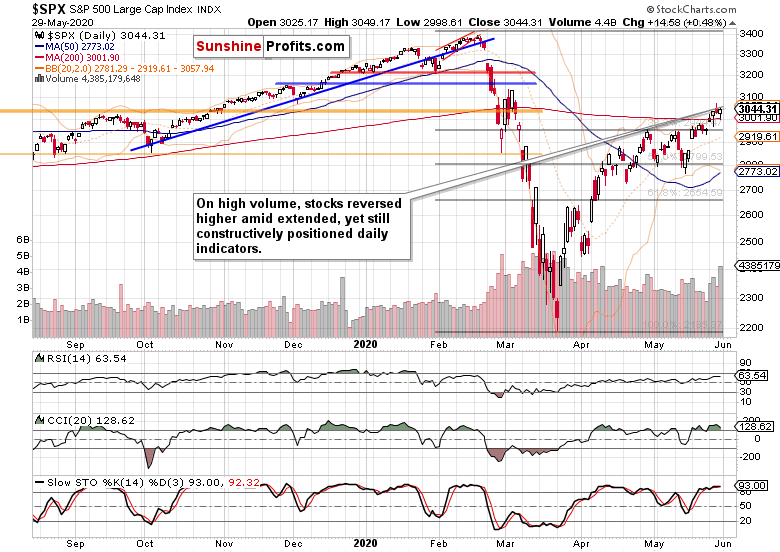
The daily chart shows that we've seen the first shot on Friday. On sizable volume, the bulls regained the initiative. Has there been a particular driver of the intraday downswing?
Let's recall Friday’s Alert:
(…) Trump will focus on China. When the latter has been announced, it marked the start of the heavy S&P 500 selling 45 minutes before the closing bell (on Thursday). As tensions have been rising, the short-term direction in stocks very much depends on the overall balance of President's announcement as regards Hong Kong, the Uyghur bill, coronavirus, the China-India border and foremost the trade deal.
Little wonder that stocks have been jittery. How did the drama end?
Let's also quote:
(…) stocks have weakened in the runup to the Trump press conference. Right after the first preliminary soundbites (notably the one that the Phase 1 China trade deal is on), stocks reversed intraday losses, and the HYG ETF moved close to its recent highs.
In other words, the prospects for the stock market upswing to reassert itself are intact.
Such were the key fundamental events late last week. But before moving over to the credit markets' perspective, let's dig some more into the daily chart's technicals.
Last week, stocks overcame both the early March gap and the 200-day moving average. The next objective for the bulls would be the early March highs at 3137. Can they make it there before the extended daily indicators call for a breather? While that's possible and appears to be a question of time, I wouldn't necessarily bet the farm on that.
After all, we've seen two intraday reversals (on Wednesday and on Friday). The odds continue favoring the bulls but a quick, out of the blue test of their resolve before the next upleg isn't out of the question.
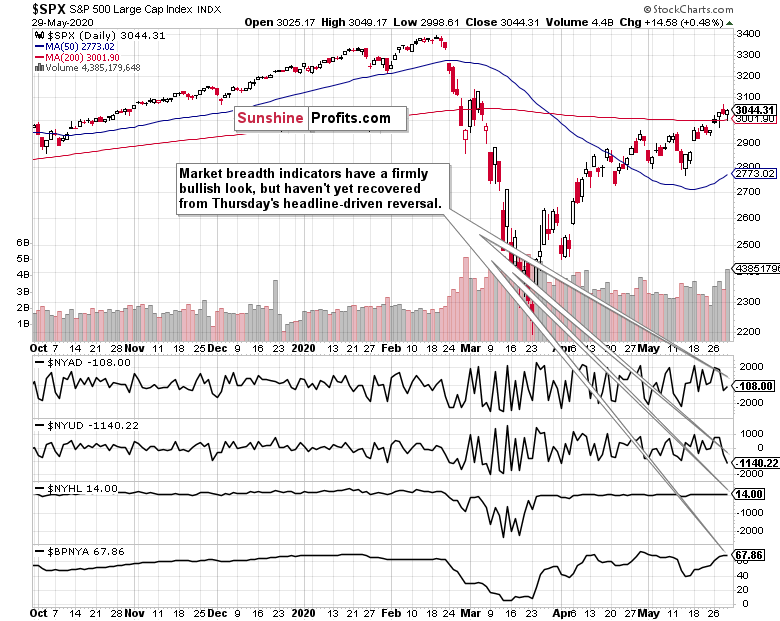
Market breadth indicators underscore the setback suffered late last week. Despite being solidly in a bull market environment as the bullish percent index shows, both the advance-decline line and advance-decline volume have retreated. On one hand, that's to the territory where their next upturns started, on the other hand, should stocks struggle in the near term, these two indicators could form negative divergencies over the coming sessions.
Now, would the credit markets support the softly cautious, yet still bullish tone?
The Credit Markets’ Point of View
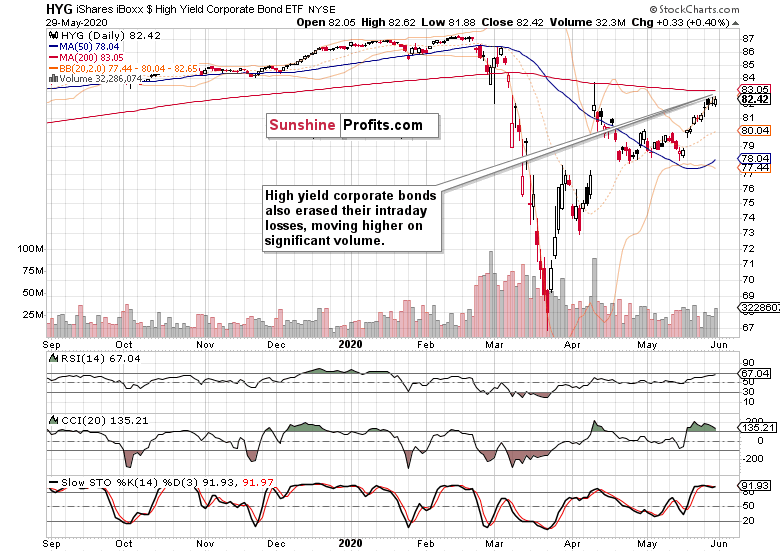
High yield corporate bonds (HYG ETF) still fully confirm the stock market upswing. Marching in lockstep higher, the bond ETF hasn't suffered any intraday losses to speak of, and closed near the daily highs. The strong uptrend remains intact, providing tailwind for stocks.
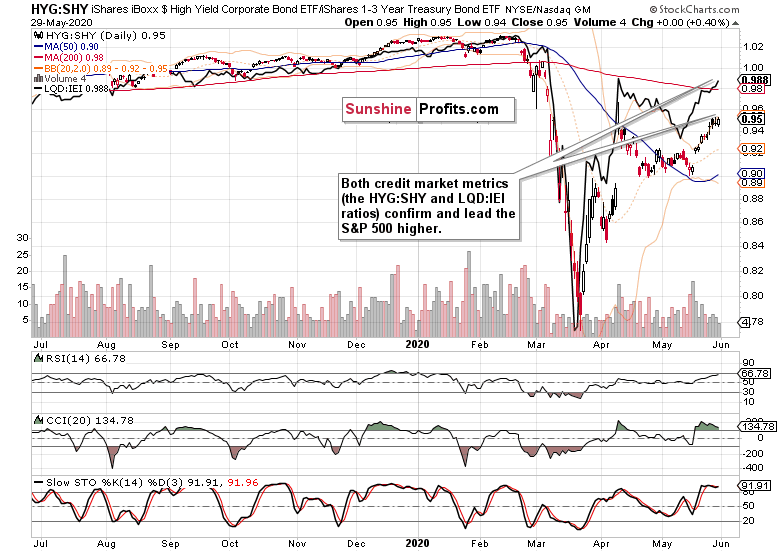
The chart of the high yield corporate bonds to short-term Treasuries ratio (HYG:SHY) with the overlaid S&P 500 prices (black line), also continues supporting the stock bull run.
Both the index itself, and the S&P 500 to Treasuries ratio have overcome their April highs. As they're moving in sync, that's conducive for the stock bull run to go on.
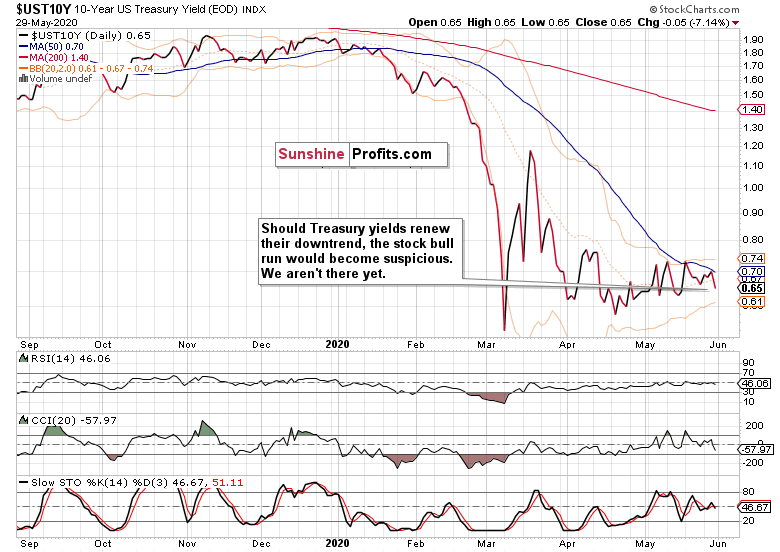
Examination of the 10-year Treasury yields confirms this conclusion. Should the yields spike to the downside, that would be a huge warning sign for stocks. But we're not in a flight to safety that would send yields plunging, bidding Treasuries higher as investors seek refuge.
The sideways trend doesn't really stand in the way of further stock gains. Conversely, should we see yields rise, that would send a clear signal that it's becoming broadly acknowledged the recovery (in stock prices too) is well underway.
But with all the Fed interventions, yields will have a really hard time rising – and keeping yields low is a key monetary policy tool employed that lits the TINA (there is no alternative) fuse, which this works to support stocks.
Key S&P 500 Sectors and Ratios in Focus
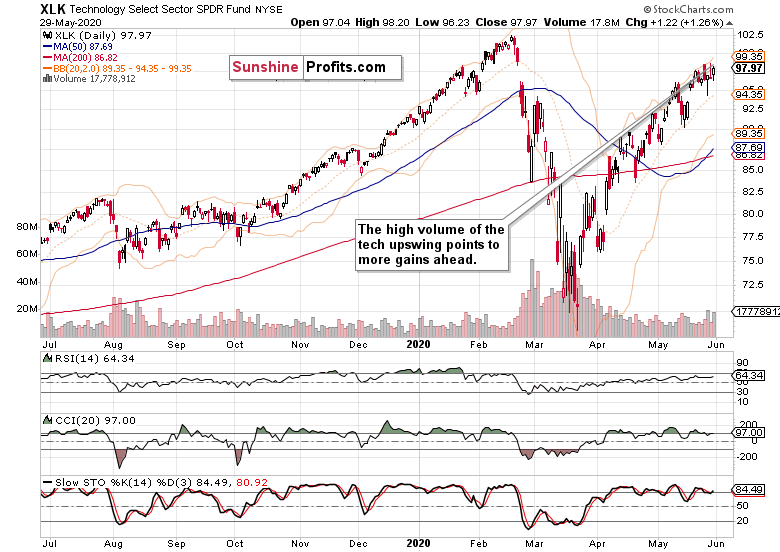
Technology (XLK ETF) continues leading higher, and both the shallow intraday losses on Friday and the subsequent rebound are giving strong hints that this run is very far from over. The sizable volume attests to that.
Within technology, semiconductors (XSD ETF) are performing strongly – they've already closed their late February bearish gap, while tech in merely on the verge of doing so. Semiconductors outperforming the behemoths is a risk-on sign, and works to lead stocks higher.
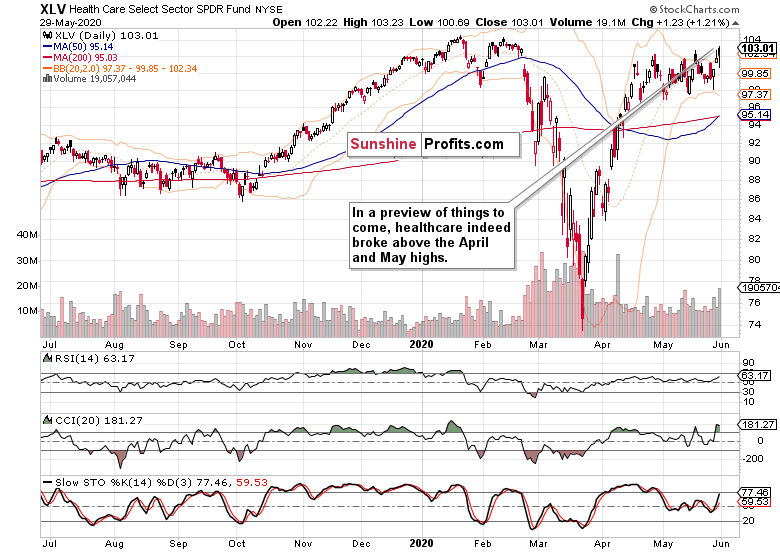
Healthcare (XLV ETF) is another star performer, and the upside breakout of the recent trading range that I have called for early on Friday, is underway now. The daily indicators are supportive of the unfolding upswing, and definitely have plenty of room to grow.
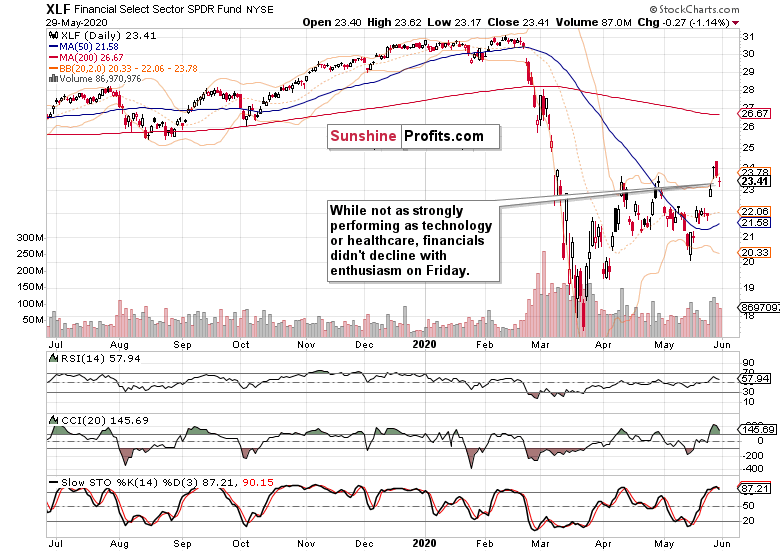
The price action in the financials (XLF ETF) also follows a bullish path. While their rebound off the March lows hasn't been as strong, they've made a solid progress in the last two weeks. Friday's breather didn't take them much lower during the day, and the daily indicators don't favor a sharp move lower. Conversely, the financials are likely to muddle through with a bullish bias over the coming weeks.
Over the last three sessions, both telecommunications (XTL ETF) and consumer discretionaries (XLY ETF) performed similarly strongly as technology did. These key S&P 500 sectors agree that higher stock prices are in our future.
It's only the leading ratios that haven't yet recovered from last week's setback. Both financials to utilities (XLF:XLU) and consumer discretionaries to staples (XLY:XLP) are pointing in the short-term direction of the amber light.
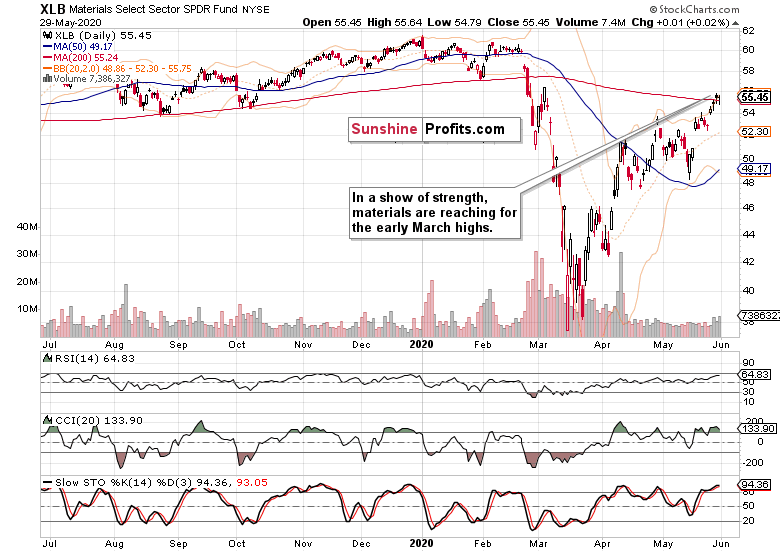
Positioned for more gains, materials (XLB ETF) have outperformed both energy (XLE ETF) and industrials (XLI ETF), leading the stealth stock bull market higher. One more argument for higher prices of materials, is the rangebound performance of the USD Index since late April.
Should the USDX really spike, that would be a meaningful fly in the ointment for many commodity prices. But after the March deflationary episode, the market is sensing inflation on the way, and that's already putting a floor below commodity prices. Remember, bonds peak first, then stocks, and finally commodities. And we haven't seen the peak in bonds yet, let alone in stocks.
Summary
Summing up, Thursday’s late-day reversal was resolved with a no bombshell dropped by Trump during Friday's press conference. Stocks reversed higher after the first signs that the fears have been overblown. The week ended on a positive note, and the stock bull market remains intact. After closing the early March gap and overcoming the 200-day moving average, the next target for the buyers are the early March highs. While the credit market and sectoral analysis favor the stock upswing to go on, the continuing weak performance of the Russell 2000 (IWM ETF) is a short-term watchout, as it hasn't caught up as vigorously as the S&P 500 did on Friday. The balance of risks in the medium-term remains skewed to the upside, but I'm striking a bit cautious tone in the very short-term.
I still expect stocks to slowly grind higher overall despite the high likelihood of sideways-to-slightly-down trading over the summer – but we’re nowhere near the start thereof. Right now, the breakout above the three key resistances (the 61.8% Fibonacci retracement, the upper border of the early March gap, and the 200-day moving average) is still unfolding with the bears running for cover and FOMO (fear of missing out) back in vogue. In short, the ball remains in the bulls’ court to show us what they're made of. The weekly and monthly charts are also leaning in the bulls' favor.
We encourage you to sign up for our daily newsletter - it's free and if you don't like it, you can unsubscribe with just 2 clicks. If you sign up today, you'll also get 7 days of free access to our premium daily Stock Trading Alerts as well as our other Alerts. Sign up for the free newsletter today!
Monica Kingsley
Stock Trading Strategist
Sunshine Profits: Analysis. Care. Profits.
* * * * *
All essays, research and information found above represent analyses and opinions of Monica Kingsley and Sunshine Profits' associates only. As such, it may prove wrong and be subject to change without notice. Opinions and analyses were based on data available to authors of respective essays at the time of writing. Although the information provided above is based on careful research and sources that are believed to be accurate, Monica Kingsley and her associates do not guarantee the accuracy or thoroughness of the data or information reported. The opinions published above are neither an offer nor a recommendation to purchase or sell any securities. Ms. Kingsley is not a Registered Securities Advisor. By reading Monica Kingsley’s reports you fully agree that he will not be held responsible or liable for any decisions you make regarding any information provided in these reports. Investing, trading and speculation in any financial markets may involve high risk of loss. Monica Kingsley, Sunshine Profits' employees and affiliates as well as members of their families may have a short or long position in any securities, including those mentioned in any of the reports or essays, and may make additional purchases and/or sales of those securities without notice.
********

Monica Kingsley is a trader and financial markets analyst. Checking dozens of charts daily, she integrates their messages with economics and in-depth experience. Trade calls and writing are her cup of tea as much as studies in market histories. Having been at the financial markets when the Great Recession arrived, she experienced many bull and bear markets - be it in stocks, bonds, gold and silver. https://www.monicakingsley.co
More from Silver Phoenix 500


