Another Day, Another S&P500 Reversal


Bucking Tuesday’s breakdown below the 50% Fibonacci retracement, stocks have pushed higher yesterday to return back around this key resistance level. The bears have suffered a setback yesterday, but it proved important to wait for the session close in order to assess the damage. Does it mean that the bulls just got their act together?
Let’s start with the S&P500 daily chart (charts courtesy of http://stockcharts.com ).
S&P 500 in the Short-Run
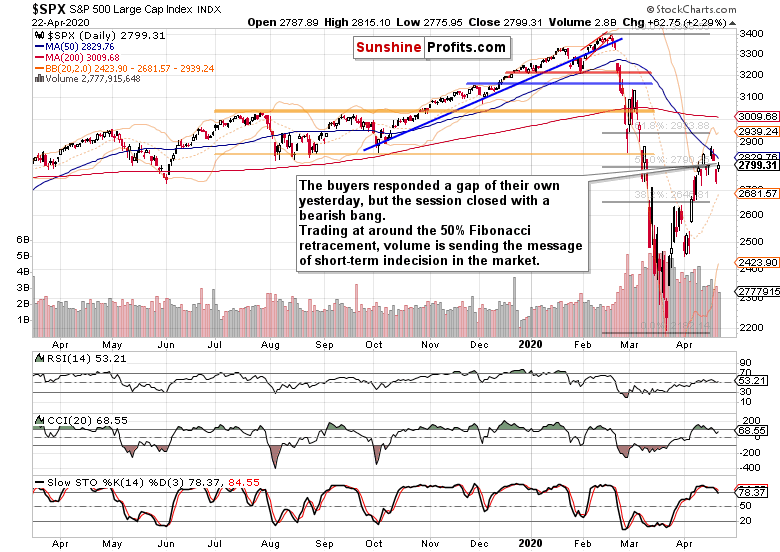
The buyers countered with their own bullish gap yesterday, and slowly but surely took prices higher throughout the day. Yet again, there was a telling twist to the session’s tone. That’s how we described it yesterday:
(…) The final 30 minutes show that just as on Monday, there was a bearish close to the session. That’s the opposite of last week’s action before the closing bell, and a bearish omen for the near term.
That’s in line with the heavy selling we saw in the final 15 minutes of yesterday’s trading. The resulting daily candle thus has a relatively sizable upper knot.
The barely noticeable change in the daily indicators means that the following observations regarding Tuesday’s downswing, remain valid:
(…) the daily indicators’ posture has clearly deteriorated. While that’s encouraging for the bears, it may still take a while for the downswing to accelerate. Actually, it might take a pause as there’s one good fundamental reason for it.
(…) As for fiscal policy news, the Senate approved almost $500bn small business and hospitals’ aid package yesterday.
As the new stimulus is making its way through the House, the S&P500 futures’ reaction remains muted. It’s that both the daily indicators and the volume comparison between yesterday’s upswing and Tuesday’s downswing, are sending a mixed picture of interim indecision.
Having said that, let’s see whether the credit markets bring more clarity to the table.
The Credit Markets’ Point of View
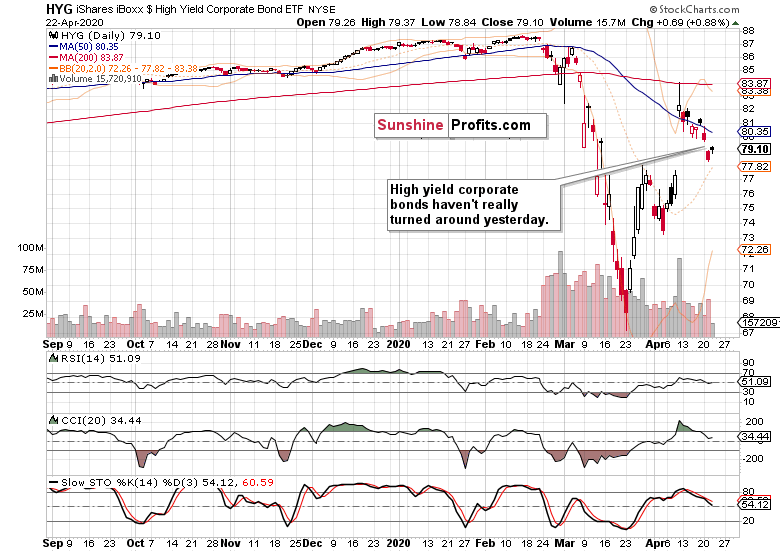
The above chart show high yield corporate bonds (HYG ETF). They haven’t materially recovered from Tuesday’s decline, and neither has their ratio to short-term Treasuries. Short-term Treasuries (SHY ETF) are holding up, while longer-term ones (IEI ETF) retreated from their highs. While it might be constructed as a bullish omen for stocks, such a conclusion based on one daily decline, wouldn’t hold water just yet as IEI is far from breaking down.
Judged by the daily indicators and very low volume of yesterday’s HYG upswing, the ETF appears consolidating before another move lower. And that doesn’t bode well for stocks marching higher.
Let’s dig into the S&P500 sectors and their ratios next.
Key S&P 500 Sector Ratios in Focus
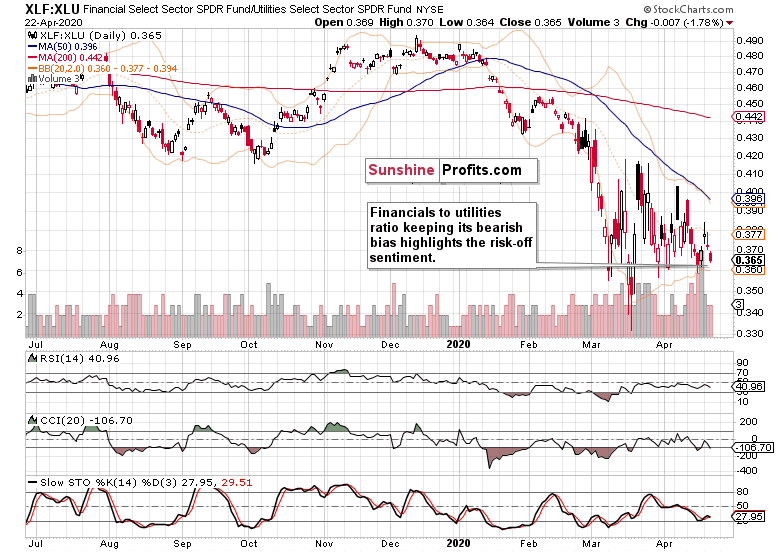
Can an S&P 500 rally be internally strong when the financials (XLF ETF) don’t enthusiastically participate? The ratio of their performance to utilities (XLU ETF) reveals just how badly they are lagging behind, both in relative and absolute terms. This doesn’t really point to a broad return of bullish spirits.
What about the consumer discretionaries to consumer staples ratio?
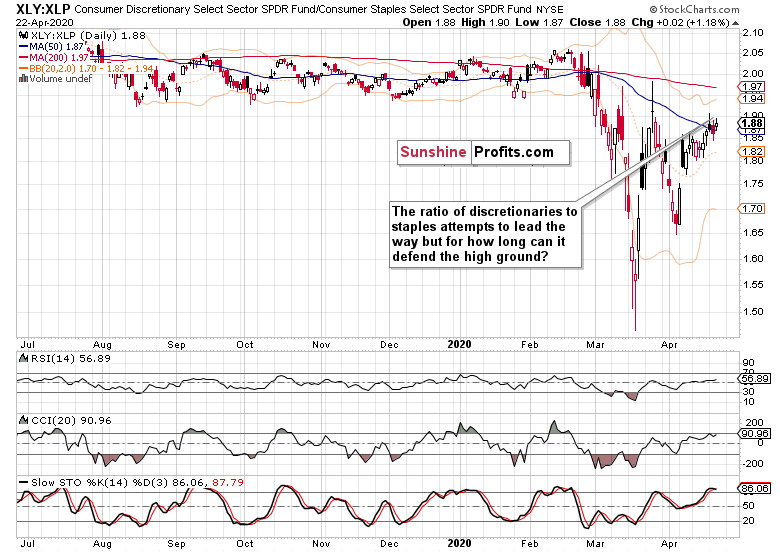
As it’s keeping near the recent highs, it shows the bulls haven’t given up and actually place faith with the consumer recovering shortly. But will retail sales come back strongly in May? We doubt that. This leading, risk-on ratio is still trading below both the early- and late-March highs. In other words, there has been no breakout that would help push the S&P 500 higher than it is now. This warrants caution in getting too optimistic, and stubbornly high Treasuries concur.
But how did the heavy-weight S&P 500 sectors do yesterday?
Technology (XLK ETF) almost made it to Monday’s closing prices before pulling off. Healthcare (XLV ETF) lagged behind and closed essentially where it had opened on Tuesday. And financials (XLF ETF) gave up half of their opening gap’s gains.
Overall, such action shows that yesterday’s upswing isn’t as strong as it appears at first sight. As a result, it’s not possible to draw bullish conclusions based on that session alone.
The Fundamental S&P500 Outlook
Today’s contribution will take aim at the coronavirus status and progress, dealing with the dilemma between lockdown relaxation because of the economy - and the epidemiological facts.
The official coronavirus death count in the US shows that the optimism coming from the plateauing curve, was premature. The incoming data from Sweden show that the country just overtook both the US and Switzerland on deaths per capita basis. While the effort to remain open for business and to leave social distancing discipline to individual responsibility and not to a government-issued mandate is laudable, it highlights the challenges on the way to achieving true herd immunity by natural means.
That’s an argument against significant lockdown relaxation and economy reopening that the countries that have pursued the stern route will surely make. On the other hand though, it’s becoming increasingly broadly voiced that the vaccine isn’t a silver bullet either due to the many Covid-19 mutations observed so far and still to come. Arguably, the situation will turn out similar to the flu vaccine that is in essence making an educated guess what flu strains will be predominantly in circulation this or that season. And educated guesses can and do backfire, as we’ve seen with flu vaccines as well.
Striking the balance between the primary need for the economy to come back to life, and managing the coronavirus outbreak, is the highest call. It’s so easy to understand and sympathize with the anti-lockdown protesters but they would help the cause of freedom more if they followed as many social distancing principles as possibly reasonable (yes, face masks are a minimum). The virus is real, and needs to be taken seriously. The choice is not either the economy, or to throw caution to the wind. Both the economic and societal recovery is a long way off, and neither comes in a V-shaped form.
Look, China just placed Harbin, a city of 11 million, under lockdown because of one asymptomatic carrier that after having spent 14-days in quarantine and being trouble-free, still inadvertently managed to infect 70 other people. Logically, if they had judged prior draconian lockdowns as essential to bring the situation more or less under control, it’s that probably it was the least painful solution in the short-term.
Meanwhile, the weekly unemployment claims just arrived. At almost 4500K again, it’s an understatement to say that the economic pain is sizable. Yet with so many lives and livelihoods at stake, the S&P 500 futures are attempting to shake it off and cross back above 2800.
Are they attempting to climb a wall of worry?
Judging by the market action at the open, it appears to be the case as the futures have reached 2820. Such momentum makes it likely that the upswing will go on later today.
When examining yesterday’s Gold & Silver Trading Alert’s perspective, we concluded that the upswing doesn’t pose danger to the breakdown below the rising support line. Let’s check today’s chart and assessment from the sais alert:
(…)
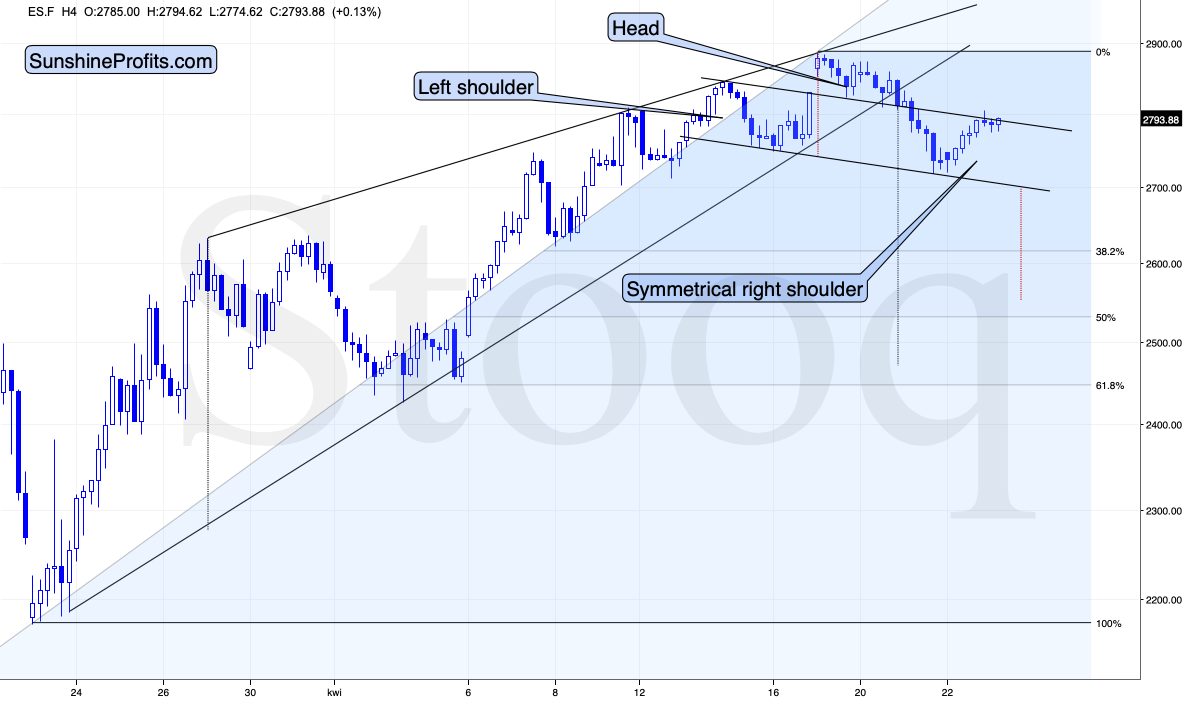
Stocks moved higher yesterday, but they were very far from invalidating their recent breakdown below the rising support line. Instead, the rally stopped at the line that’s parallel to the neck level of what could become a head and shoulders pattern. Creating such lines allows us to see how high should a given market rally for the pattern to be symmetrical. These patterns don’t have to be perfectly symmetrical, but quite often they tend to be.
Of course, the head-and-shoulders pattern is in progress and not completed yet, but by the same token, it’s far from being invalidated.
What would be a prudent course of action given all the above?
We’re of the opinion that opening a short-term hedging position on the long side is justified. The full position details are reserved for our subscribers.
From the Readers’ Mailbag
Q: What does the candle stick we hit today mean? Looks almost like a doji star? 2 bearish candle sticks followed by a green doji star i couldn’t find anything to compare it to. I’m assuming bearish because we closed pretty close to the open?
A: Yesterday’s candle just goes to show the tug-of-war between the buyers and the sellers when their forces are relatively balanced in the very short-term. To say so with any degree of confidence, one has to look at the context and not an individual candlestick. While that’s still important, it’s the context that gives it meaning. Even within candlesticks, there are formations that involve just one, or several recent ones.
Anyway, the point is to tip the scales in this high-probability game in our favor. Does the shape of yesterday’s candle decidedly do so? No, but coupled with the daily volume and swing highs and lows examination, it’s another piece in the puzzle of where might stocks go most probably next.
Remember, diligent money management and working patiently with an edge as you evaluate your currently open trade, is what counts.
If you had no position open, would you be in that trade that you’re currently in? If so, then keeping the position open makes sense. Even if the open position temporarily goes nowhere, you never know what would be the catalyst of the most probable upcoming move. Actually, there might not even need to be one.
Summing up, the S&P 500 retraced quite a part of Tuesday’s declined, making the very short-term outlook rather neutral but with strong bearish undertones. As prices returned to trading around the 50% Fibonacci retracement, and are attempting to move above it again today, the credit markets continue to underperform. As the key sectoral ratios are leaning bearish, they still hint at the need to be patient and let the April upswing run its course and be recognized as over. While that hasn’t happened yet, the coronavirus death count is rising again after a short reprieve (where does that leave the reopening?), new unemployment claims remain off the charts with manufacturing, retail sales, consumer confidence and the like more likely to take it on the chin than not. While the balance of risks favors a move to the downside to continue, and thus our short position would remain justified, stocks appear on the verge of another short-term upswing to capitalize on.
We encourage you to sign up for our daily newsletter - it's free and if you don't like it, you can unsubscribe with just 2 clicks. If you sign up today, you'll also get 7 days of free access to our premium daily Stock Trading Alerts as well as our other Alerts. Sign up for the free newsletter today!
Monica Kingsley
Stock Trading Strategist
Sunshine Profits - Effective Investments through Diligence and Care
* * * * *
All essays, research and information found above represent analyses and opinions of Przemyslaw Radomski, CFA and Sunshine Profits' associates only. As such, it may prove wrong and be subject to change without notice. Opinions and analyses were based on data available to authors of respective essays at the time of writing. Although the information provided above is based on careful research and sources that are believed to be accurate, Przemyslaw Radomski, CFA and his associates do not guarantee the accuracy or thoroughness of the data or information reported. The opinions published above are neither an offer nor a recommendation to purchase or sell any securities. Mr. Radomski is not a Registered Securities Advisor. By reading Przemyslaw Radomski's, CFA reports you fully agree that he will not be held responsible or liable for any decisions you make regarding any information provided in these reports. Investing, trading and speculation in any financial markets may involve high risk of loss. Przemyslaw Radomski, CFA, Sunshine Profits' employees and affiliates as well as members of their families may have a short or long position in any securities, including those mentioned in any of the reports or essays, and may make additional purchases and/or sales of those securities without notice.
********

Monica Kingsley is a trader and financial markets analyst. Checking dozens of charts daily, she integrates their messages with economics and in-depth experience. Trade calls and writing are her cup of tea as much as studies in market histories. Having been at the financial markets when the Great Recession arrived, she experienced many bull and bear markets - be it in stocks, bonds, gold and silver. https://www.monicakingsley.co


