ASX200 Technical Analysis


I have been calling for new rally highs in the Australian stock index, the ASX200, and nothing has changed my view on that. The only thing that has changed is my confidence - it has increased. Let’s find out why beginning with the weekly chart.
ASX200 WEEKLY CHART
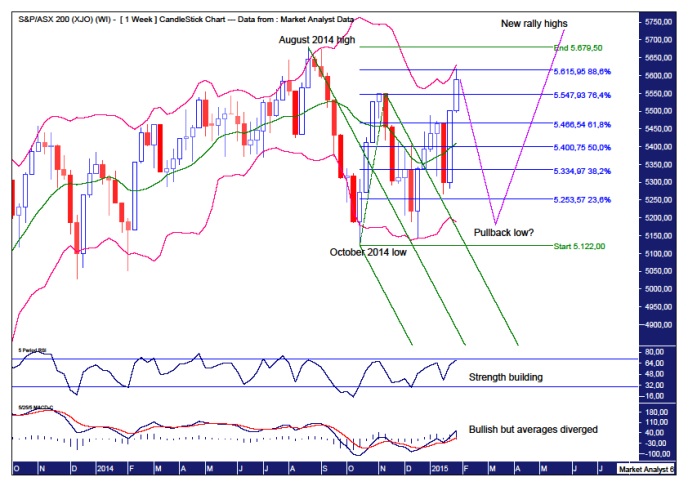
I have added Bollinger Bands which show the recent surge in price has gone up to virtually touch the upper band. However, I don’t think this is part of the next leg up to new rally highs. Instead, I think the corrective phase is still playing out. Corrective phases commonly see price bouncing up and down between the upper and lower bands and I expect one last drop back to the lower band before the move to new rally highs commences. The lower band is currently just below 5200.
I have added Fibonacci retracement levels of the move down from August 2014 high to October 2014 low. Price has just clipped the 88.6% level putting in a high 4 points above at 5619. I think that is a short term high.
The Relative Strength Indicator (RSI) is trending up showing a pattern of higher lows and a higher high indicating strength is building.
The Moving Average Convergence Divergence (MACD) indicator is also trending up and looking bullish although the averages have diverged quite a bit so a pullback would bring them back into line.
I have also added an Andrew’s Pitchfork just to show the bullishness being exhibited. Price broke out above this pitchfork formation back in December and recently went back down but held above the upper pitchfork trend line. So price appears to have escaped the clutches of this bearish pitchfork.
Let’s now bring it in tight with the daily chart.
ASX200 DAILY CHART
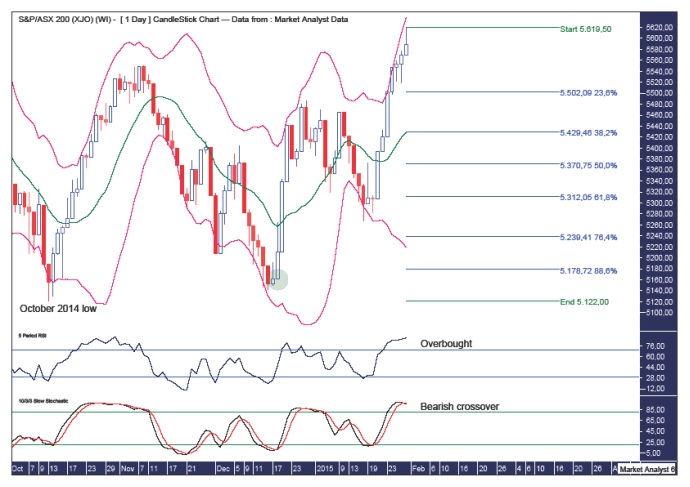
The RSI is well overbought while the Stochastic indicator has just made a bearish crossover. A move down looks in order, me thinks.
The Bollinger Band show price started to move away from the upper band before having another crack at getting back in touch with it. That looks like the last hurrah for this move up. I now expect a move back to the lower band.
I am looking for a deep retracement as price lays the last of the foundations before the move to new rally highs. I have added Fibonacci retracement levels of the move up from October 2014 low to recent high. I am looking for a move back to the 88.6% level at 5172. Quite frankly, I think price will push even deeper.
I have drawn a green highlighted circle which shows the area whereby price launched higher in a parabolic move higher. Price often eventually corrects back to these levels and I expect that to occur here. This is around the 5150 level.
Let’s now zoom back out to get a look at the bigger picture with the monthly chart.
ASX200 MONTHLY CHART
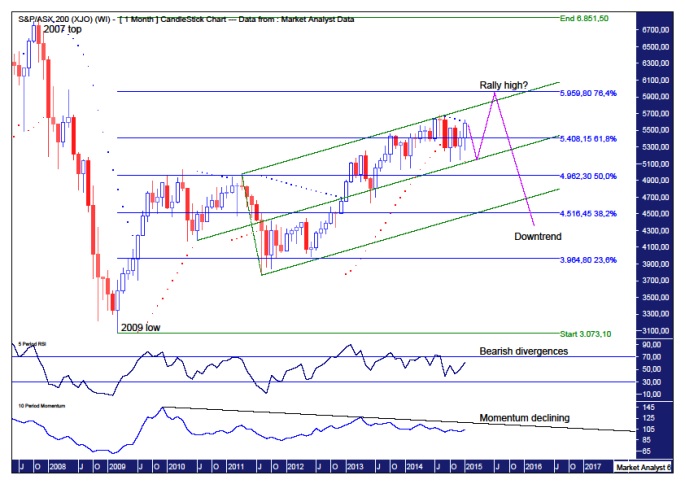
The Parabolic Stop and Reverse (PSAR) indicator shows price has just busted the dots to the upside so a bullish bias is now in force. However, a common occurrence after this happens is price then goes back down to test the support given by the dots which are now on the downside. These dots now stand at 5129 and will increase each month.
I have drawn an Andrew’s Pitchfork which shows the uptrend still in a solid position within the upper pitchfork channel. I am looking for a move back which finds support at the middle pitchfork trend line.
I am looking for the move down to complete around early March before launching to new rally highs. I expect this final rally high to do a little “up and over” of the pitchfork formation before reversing back down.
I have added Fibonacci retracement levels of the move down from 2007 top to 2009 low. I am looking for the final rally high to be around the 76.4% level at 5959.
The RSI is currently showing bearish divergences and I’d like to see the final high also showing, preferably, multiple bearish divergences. Let’s see.
The Momentum indicator shows momentum has been declining for quite some time and I’d like to see the final high be rejected at the trend line I have drawn.
Summing up, the ASX200 looks to still be in the process of building some solid and sturdy foundations from which price should launch higher in the coming months.
********
Courtesy of www.thevoodooanalyst.com
© 2014 Copyright The Voodoo Analyst - All Rights Reserved
Disclaimer: The above is a matter of opinion provided for general information purposes only and is not intended as investment advice. Information and analysis above are derived from sources and utilising methods believed to be reliable, but we cannot accept responsibility for any losses you may incur as a result of this analysis. Individuals should consult with their personal financial advisors. Put simply, it is JUST MY OPINION.
More from Silver Phoenix 500


