The Best Kept Secret In The Financial World: GOLD & SILVER Performance since 2001


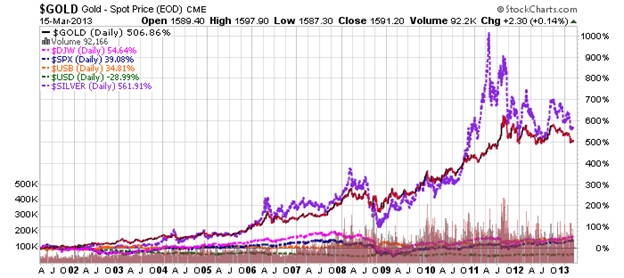
First let’s consider the outstanding performance of GOLD & SILVER since 2001. The chart below clearly demonstrates the outrageously formidable appreciation of gold and silver vis-à-vis other asset classes during the past 12 years (to March 13, 2013). Specifically, here are the total increases in value during the period:
GOLD price has soared……………………………… +513% (equivalent to CAGR (*) of +16.4%/year)
SILVER price has soared……………………………..+570% (equivalent to CAGR (*) of +16.7%/year)
Global Equities (DJ World Stock Index)………...........+51% (equivalent to CAGR (*) of +4.0%/year)
S&P500 Stock Index………………………..………...…+35% (equivalent to CAGR (*) of +3.1%/year)
U.S. Treasuries……………………………....……...……+34% (equivalent to CAGR (*) of +2.5%/year)
U.S. Dollar Index……………………....…..……….…….-28% (equivalent to CAGR (*) of -2.9%/year)
CAGR (*) means Compound Annual Growth Rate.
The U.S. Dollar Index negative ‘performance’ is to emphasize the loss of purchasing power suffered by those hapless investors in Money Market Funds, U.S. T-Bonds and Cash.
GLOBAL ASSET ALLOCATIONS
The draconian difference in performances is actually The Best Kept Secret In The Financial World for the following reason. The chart below shows total Global Asset Allocations. Specifically, the world’s total investing public has allocated their investment s per the following:
Bonds…………………………………..……..49%
Equities (ie stocks)…………………….…….37%
Money Markets……………………….………9%
Alternative Investments……………...….......4%
GOLD……………………….……..…..……….1%

(Courtesy of SilverDoctors.com & Deutsche Bank)
Obviously, only the very sophisticated and well informed investors have enjoyed this performance by putting a part of their total portfolio in GOLD.
To be sure that will change, because of the pervasive communication power of the Internet (aided by TV networks finally becoming aware of GOLD and SILVER’s outstanding performance), it is logical to expect that Global Asset Allocation to GOLD will grow exponentially going forward. Moreover, added impetus for GOLD INVESTMENT GROWTH will be fueled by other factors, such as:
- Growing number of new ETF’s investing in GOLD and SILVER
- Increasing number of Central Banks diversifying FOREX Risk by buying GOLD
- Greatly increased media advertising of precious metal products
- Currency wars throughout the world, thus debasing the value of their money
- More implementation of Quantitative Easing in the US, Euro Union and Japan
- Word of mouth advertising to family and friends, thus increasing overall demand.
Economics-101 dictates that when demand for a commodity increases – and supply is either stable or diminishing, the price of that commodity must inevitable rise. In the case of GOLD, the annual supply is flat. However SILVERS case demonstrates yearly deficits, because more than 60% of the annual mine production is consumed by industrial usage.
In view of all the above, one may only guess at how much GOLD and SILVER will rise during the next 5-10 years. In fact not a few experts are forecasting GOLD to reach $5,000…$10,000…yes, and even as high as $15,000 – and remember SILVER runs in the shadow of GOLD…albeit with much higher volatility.
CAVEAT EMPTOR: All investors must remember there will inevitably be periods of consolidation (ie corrections – like the present one) , when precious metal rise too far too fast. However, these corrections are a godsend, allowing astute investors to accumulate GOLD and SILVER on the cheap.
NIA & DYODD
* * * * * * * * *
I.M. Vronsky
GOLD-EAGLE


