The Big Commercial Silver Shorts Stand Pat


Gold's high tick of the day, such as it was, was set a few minute before 9 a.m. China Standard Time on their Friday morning in GLOBEX trading -- and from there it was sold quietly and unevenly lower until the noon silver fix in London. It rallied a bit from the until the b.s. job report hit the tape at 8:30 a.m. in New York -- and was then hammered lower, with its low tick coming around 9:15 a.m. EDT. It was then allowed to rally for exactly one hour, before its price was turned quietly lower once more -- and that tiny sell-off lasted until around 12:10 a.m. EDT. It crept a bit higher from there until the market close at 5:00 p.m.
The high and low ticks were reported as $1,800.50 and $1,769.80 in the October contract -- and $1,811.60 and $1,780.20 in December. The August/October price spread differential in gold at the close in New York yesterday was $7.60... October/December was $10.70 -- and December/February was $13.00 an ounce.
Gold was closed on Friday afternoon in New York at $1,776.40 spot, down $14.80 on the day. Net volume in October and December combined was pretty healthy at a bit under 170,500 contracts -- and there was 7,000 contracts worth of roll-over/switch volume on top of that.

The silver price wandered quietly higher until around 1 p.m. CST in GLOBEX trading on their Friday afternoon -- and after that, its price path was guided in an almost identical fashion as gold's for the remainder of the Friday trading session everywhere on Planet Earth.
The high and low ticks in silver were recorded by the CME Group as $20.28 and $19.47 in the September contract. The September/December price spread differential in silver at the close in New York on Friday was 15.2 cents -- and December/March was a hefty 19.3 cents an ounce.
Silver was closed in New York on Friday afternoon at $19.91 spot, down 24.5 cents from its close on Thursday. Net volume was just about 48,500 contracts -- and there was 17,000 contracts worth of roll-over/switch volume out of September and into future months...mostly December, but a bit into March as well.
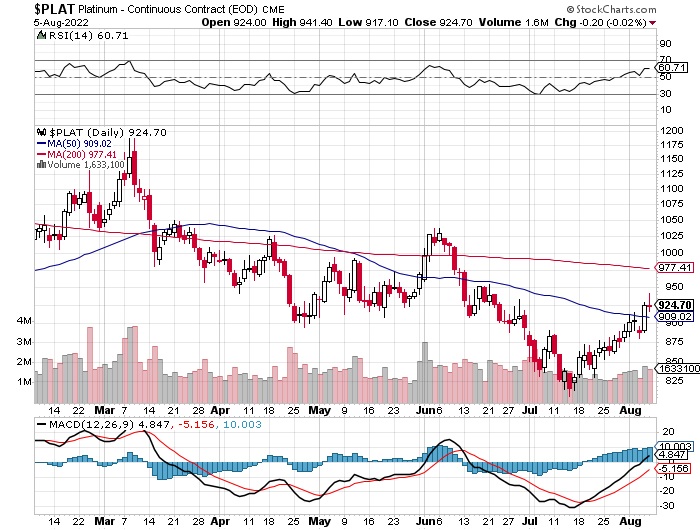
Platinum crawled quietly higher in price right from the 6:00 p.m. open in New York on Thursday evening - and that lasted until around 9:20 a.m. in GLOBEX trading in Zurich. It didn't do anything from there until around 12:15 p.m. CEST -- and then began to creep higher anew until the jobs report appeared at 8:30 a.m. in New York. Its rally off its 9:15 a.m. EDT low tick was capped about fifteen minutes after the 11 a.m. EDT Zurich close -- and it was sold lower until 1 p.m. in COMEX trading. From that juncture it crept quietly higher until trading ended at 5:00 p.m. EDT. Platinum closed up 5 dollars on the day.
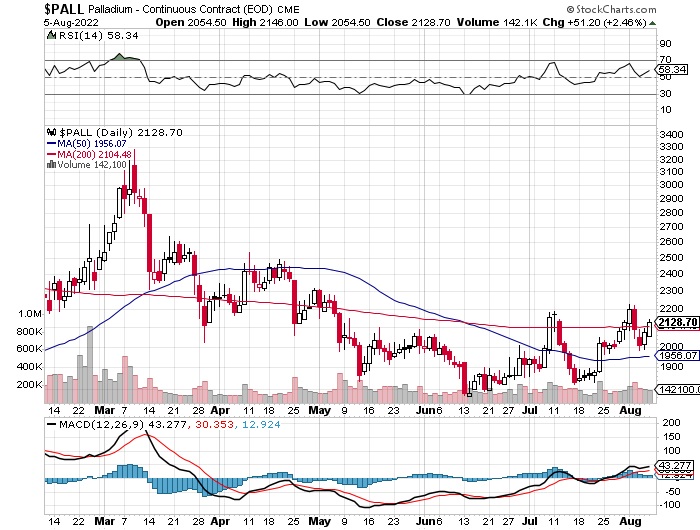
Palladium had a very uneven up/down move centered around 10 a.m. in Zurich on their Friday morning -- and that lasted until the noon silver fix in London. It also rallied into the jobs number -- and was also smacked lower by a bit at that point until minutes before 9 a.m. in COMEX trading in New York. It took off higher from there, but ran into 'something' around 10:10 a.m. -- and from that juncture was sold quietly and a bit unevenly lower until minutes before trading ended at 5:00 p.m. At that point it jumped up a bunch going into the close. Palladium finished the Friday trading session in New York at $2,064 spot, up 60 bucks on the day -- and 17 dollars off its Kitco-recorded high tick.
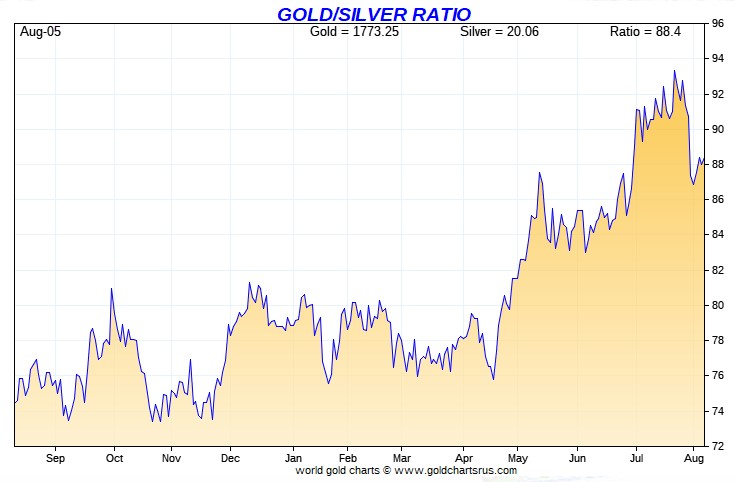
Based on the kitco.com spot closing prices in silver and gold posted above, the gold/silver ratio worked out to 89.2 to 1 on Friday...compared to 88.9 to 1 on Thursday.
And here's Nick Laird's 1-year Gold/Silver Ratio Chart, updated with this past week's data and, like last week, Friday's gold/silver ratio value isn't on this chart, either. Click to enlarge.
---------
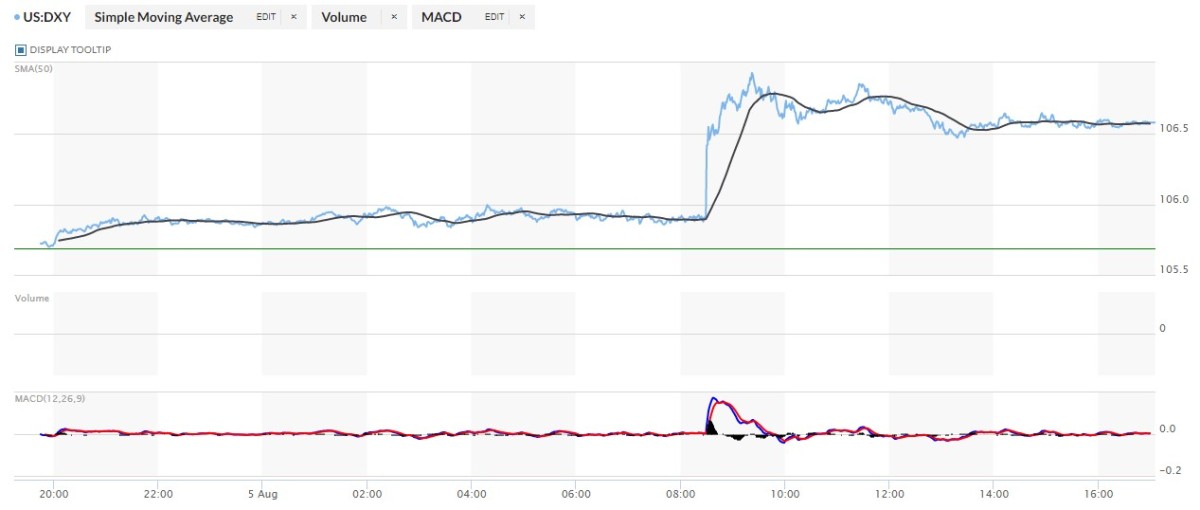
The dollar index closed very late on Thursday afternoon in New York at 105.69 -- and then opened higher by 3 basis points once trading commenced at 7:45 p.m. EDT on Thursday evening, which was 7:45 a.m. China Standard Time on their Friday morning. It proceeded to drift quietly higher from there until 2:22 p.m. CST -- and then crept equally quietly lower until b.s. non-farm payroll number hit the tape at 8:30 a.m. in Washington. That sent the DXY screaming higher -- and its high of the day was set at 9:22 a.m. EDT. From that point it wandered quietly lower until around 12:52 p.m. - and it didn't do much of anything after that.
The dollar index finished the Friday trading session in New York at 106.58... up 88 basis points from its close on Thursday.
Here's the DXY chart for Friday, thanks to the good folks over at the marketwatch.com Internet site as usual. Click to enlarge.
And here's the 5-year U.S. dollar index chart that shows up in this spot in every Saturday column...courtesy of stockcharts.com as always. The delta between its close...106.49...and the close on the DXY chart above, was 9 basis points below its indicated spot close. Click to enlarge as well.
---------
It was obvious, at least to me, that the b.s. jobs report and the DXY 'rally' that began at the same instant, was used as cover to blast gold, silver and platinum lower.
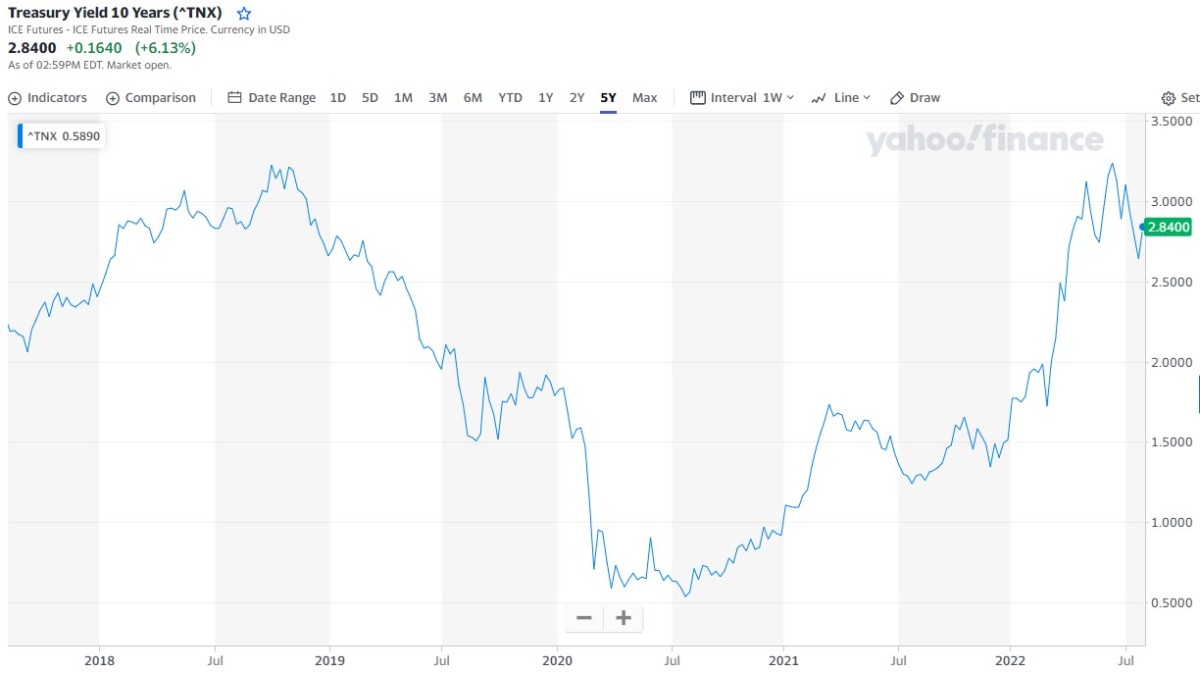
U.S. 10-Year Treasury: 2.8400%...up 0.1640 (+6.13%)...as of 02:59 p.m. EDT
That's the biggest one-day move I've ever seen in the 10-year -- and Gregory Mannarino has something to say about it in his market commentary in the Critical Reads section further down.
Here's the 5-year 10-year U.S. Treasury chart from the yahoo.com Internet site -- and it puts the yield curve into a somewhat longer-term perspective. Click to enlarge.
The massive interventions in the sovereign debt markets of the world continued without respite again this week...especially in the U.S. Treasury market. Despite all the jawboning from the Fed and the other central banks, the money printing has never stopped -- and never can. It's exactly as Richard Russel said..."it's print, or die." Of course that will at some point turn into "print -- and die"...as the underlying currencies get debased into nothing. At some point that will turn hyper-inflationary when the hoi polloi finally come to understand what's being done to them...but we're not there yet.
-----------
Not surprisingly, the gold shares gapped down at the 9:30 opens of the equity markets in New York on Friday morning -- and continued lower until gold's low tick was set at 9:15 a.m. They then rallied until the 11 a.m. EDT London close -- and then sank a bit more until minutes before 12 o'clock noon. From that point they wandered higher until they rallied rather sharply in the last hour of trading. The HUI closed lower by only 0.88 percent.
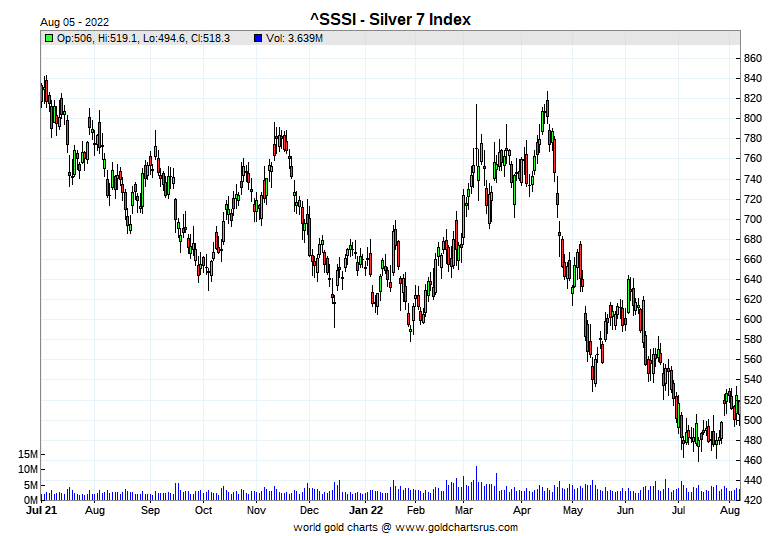
Computed manually, Nick Laird's Intraday Silver Sentiment/Silver 7 Index closed down 1.14 percent...dragged down by Peñoles once again.
Here's Nick's 1-year Silver Sentiment/Silver 7 Index chart, updated with Friday's candle. Click to enlarge.
There were three 'stars' yesterday. SSR Mining closed up on the day by 0.96 percent, First Majestic Silver closed unchanged -- and Wheaton Precious Metals closed lower by only 0.09 percent. As just stated above, the big dog was Peñoles, closing down 4.57 percent, but only on 300 shares traded.
Taking them out of the mix, the index closed lower by only 0.57 percent.
Since this is my Saturday column, here's something a bit off topic, but very fascinating. The Fagradalsfjall volcano in Iceland began to erupt again out of new fissure four days ago -- and I've had the live-stream of it open on my desktop ever since. It's far more active than the eruption from last year and has already pumped out 4.5 million cubic meters of lava since it began erupting about 1:15 p.m. local time on Tuesday. The link to it is here. The weather was a bit inclement there when I last looked. But it's going gangbusters.
There's also two short videos of it from late yesterday evening from one of the local Icelandic volcano enthusiasts, Gutn Tog. The first is linked here -- and the second, here. Both are worth your time.
The latest silver eye candy from the reddit.com/Wallstreetsilver crowd is linked here.
-----------
Here are two of the usual three charts that show up in every weekend missive. They show the changes in gold, silver, platinum and palladium in both percent and dollar and cents terms, as of their Friday closes in New York — along with the changes in the HUI and the Silver 7 Index.
Here's the weekly chart...which doubles as the month-to-date chart for this week only -- and platinum stole the show. The gold stocks finished down a bit, even though the gold price closed up a hair. But on a relative basis, the silver equities 'outperformed' their golden cousins. A one-week sample doesn't say much considering the enormous 'volatility' we've seen all week in all the precious metals. Click to enlarge.
Here's the year-to-date chart and, with the exception of palladium once again, it's obviously not very happy looking. As I say in this space just about every week now, it's my opinion that there's been a very quiet and stealthy accumulation of silver equities going on in the deep background for quite some time -- and that fact is certainly obvious on this chart. The silver and gold shares are down just about equally year-to-date, but relative to the performance of their respective underlying precious metals, the silver stocks are obviously doing much better. That will continue for the foreseeable future. Click to enlarge.
Of course, as I always say at this point, what happens going forward continues to be in the hands of the commercial traders of whatever stripe, as they alone...as you know all too well...either directly or indirectly control the prices of everything precious metals-related...until they don't.
----------
The CME Daily Delivery Report for Day 7 of August deliveries showed that 260 gold -- and 1 lone silver contract were posted for delivery within the COMEX-approved depositories on Tuesday.
In gold, there were four short issuers in total -- and the largest was French bank BNP Paribas Securities, as they issued 150 contracts out of their house account. They were followed by Citigroup, Marex Spectron and Dutch bank ABN Amro, as they issued 70, 26 and 10 contracts out of their respective client accounts. There was another huge list of long/stoppers -- and JPMorgan was the largest, picking up 84 contracts in total...83 for clients -- and remaining contract for their own account. Next was BofA Securities, stopping 49 contracts for their house account -- and close behind them was Goldman Sachs, picking up 43 contracts in total...31 for their own account, plus 12 for clients. Citigroup stopped 31 in total...28 for their house account -- and the remaining 3 contracts for clients.
In silver, the lone short/issuer was Advantage -- and ADM stopped it.
The link to yesterday's Issuers and Stoppers Report is here.
So far in August there have been 28,012 gold contracts issued/reissued and stopped -- and that number in silver is 791 contracts. In platinum, there have been 126 contracts issued and stopped.
The CME Preliminary Report for the Friday trading session showed that gold open interest in August dropped by 1,404 COMEX contracts, leaving 3,784 still around, minus the 260 contracts mentioned a bunch of paragraphs ago. Thursday's Daily Delivery Report showed that 1,746 gold contracts were actually posted for delivery on Monday, so that means that 1,746-1,404=342 more gold contract just got added to the August delivery month. Silver o.i. in August declined by 8 contracts, leaving 96 still open, minus the 1 contract mentioned a few paragraphs ago. Thursday's Daily Delivery Report showed that 8 silver contracts were actually posted for delivery on Monday, so the change in open interest and deliveries match for once.
Total gold open interest at the close on Friday fell by 6,884 COMEX contracts -- but total silver o.i. rose by 1,960 contracts...with both numbers subject to some revision by the time the final figures are posted on the CME's website on Monday morning CDT.
------------
There was a smallish withdrawal from GLD yesterday, as an authorized participant took out 37,275 troy ounces of gold -- and there was also 19,861 troy ounces of gold taken out of GLDM. There were no reported changes in SLV.
In other gold and silver ETFs and mutual funds on Planet Earth on Friday, net of any changes in COMEX, GLD, GLDM & SLV inventories, there was a net 43,746 troy ounces of gold added, but 397,219 troy ounces of silver was removed, involving three separate ETFs.
There was no sales report from the U.S. Mint on Friday -- and none month-to-date for August.
-----------
There was very decent activity in gold over at the COMEX-approved depositories on the U.S. east coast on Thursday. They reported receiving 37,809.576 troy ounces/1,176 kilobars -- and 139,645 troy ounces was shipped out.
In the 'in' category, the largest amount was the 35,494.704 troy ounces that was dropped off at Brink's, Inc. -- and the remaining 2,314.872 troy ounces/72 kilobars arrived at Delaware.
The largest 'out' amount was the 73,362 troy ounces that left Manfra, Tordella & Brookes, Inc. -- and the remaining 66,093 troy ounces departed Brink's, Inc.
There was a lot of paper activity, as a net 228,274 troy ounces was transferred from the Registered category and back into Eligible. The largest amount that was transferred in that direction was the 166,863.690 troy ounces/5,190 kilobars made that trip over at Malca-Amit USA -- and that was followed by the 84,495 troy ounces that made the trip in that same direction over at Brink's, Inc. The next two biggest amounts were the 24,588 and the 15,629 troy ounces that were transferred in that direction over at JPMorgan and Manfra, Tordella & Brookes, Inc. The only gold transferred from the Eligible category and into Registered was the 69,186 troy ounces that happened over at HSBC USA...no doubt scheduled for delivery this month.
The link to all of Thursday's COMEX activity in gold, is here.
It was another very busy day in silver, as 1,430,055 troy ounces was received -- and 107,731 troy ounces was shipped out.
The largest two 'in' amounts were the two truckloads...599,001 and 585,312 troy ounces...that arrived at Loomis International and JPMorgan respectively. The remaining 245,731 troy ounces ended up at Delaware.
The largest 'out' amount as the 99,588 troy ounces that was shipped out of CNT... followed by the 4,991 troy ounces/one COMEX contract and 3,151 troy ounces that left JPMorgan and Delaware respectively.
There was some paper activity. First off, there was 133,641 troy ounces transferred from the Eligible category and into Registered over at JPMorgan...not doubt scheduled for delivery this month some time. The remaining 99,815 and 5,149 troy ounces was transferred from the Registered category and back into Eligible over at Delaware and Brink's, Inc. respectively.
The link to all of Thursday's COMEX activity in silver, is here.
For a change, there wasn't much activity over at the COMEX-approved gold kilobar depositories in Hong Kong on their Thursday. Nothing was reported received -- and only 551 kilobars were shipped out...396 from Brink's, Inc. - and the other 155 kilobars departed Loomis International. The link to that, in troy ounces, is here.
------------
Here are the usual 20-year charts that show up in this space in every Saturday column. They show the total amount of physical gold and silver held in all know depositories, ETFs and mutual funds as of the close of business on Friday.
During the week just past, there was a net 992,000 troy ounces of gold removed -- and a net 606,000 troy ounces of silver was taken out as well.
According to Nick Laird's data on his website, there has been a net 5.19 million troy ounces of gold -- plus a net 39.31 million troy ounces of silver removed from all the world's known depositories, mutual funds and ETFs during the last four weeks...with 80 percent of that silver coming out of SLV. Click to enlarge for both.
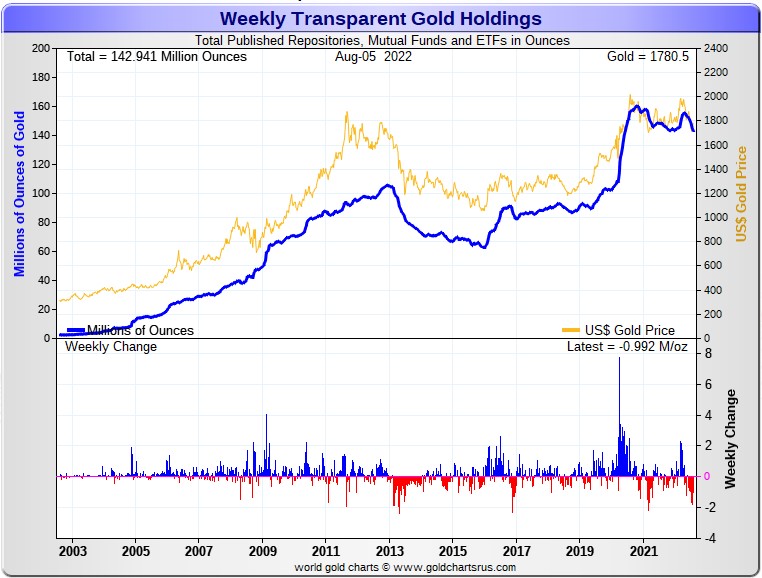
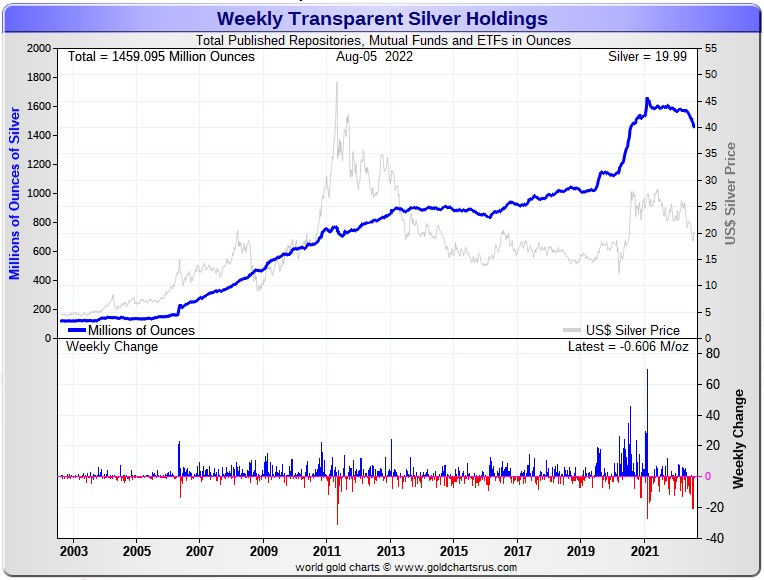
In gold, the withdrawals were mostly COMEX/JPMorgan related, but with some out of the other world's ETFs as well. For a change, GLD was not involved, as only about 120,000 troy ounces was removed on a net basis during the reporting week. The decrease in silver was mostly from the COMEX, as a bit over 2 million troy ounces of silver was added to SLV on a net basis during this past week.
The physical shortage in silver on the wholesale level continues -- and one has to wonder just how much of these silver withdrawals we've witnessed this past week are industrial user-related...or conversion of shares for physical metal.
Retail silver demand isn't what it used to be, but has certainly picked up quite a bit since the low in silver was set about ten days ago, because everyone senses that the worst is over -- and they've been buying the dip aggressively.
And with the obvious exception of the industrial demand component, almost the same thing can be said about all these gold withdrawals.
Delivery times from the various sovereign and private mints continues to be many weeks for some forms of retail silver -- and that fact is probably not going to change anytime soon. But from what I've seen from the various precious metal websites I lurk at, there's pretty good inventory in all the popular bar and coins sizes.
But the real shortages will begin in the wholesale good delivery bar market when the serious money starts flowing into the world's various and sundry, depositories, ETFs and mutual funds now that it appears that the rally off the bottom has begun.
Where all those good delivery bars...especially in silver...going to come from as we move substantially higher in price in the weeks and months ahead?
Ted's of the opinion that most of the silver withdrawals from SLV have been conversion of shares for physical metal -- and considering the price activity lately, I suspect he would be right about that.
And in closing here, I'll mention once again that virtually all of the two precious metals in these funds are held by the strongest of hands -- and I'm sure that applies to every troy ounce that has been withdrawn from them as well.
--------
The Commitment of Traders Report, for positions held at the close of COMEX trading on Tuesday showed the expected increases in the commercial net short positions in both gold and silver...with the number in gold being higher than expected.
In silver, the Commercial net short position increased by 6,411 COMEX contracts, or 32.1 million troy ounces -- and it was all raptor/small commercial long selling that accounted for it.
They arrived at that number by decreasing their long position by 6,544 contracts, but also decreased their short position by 133 contracts -- and it's the difference between those two numbers that represent their change for the reporting week.
Under the hood in the Disaggregated COT Report the Managed Money traders decreased their net short position by 8,962 COMEX contacts -- and the did this by selling 3,694 long contracts, plus they covered 12,656 short positions. The surprise for both Ted and I was the fact that the traders in the Other Reportables category were sellers during the reporting week, as they reduced their net long position by 3,488 contracts. One would have thought they would have been buyers during the reporting week's rally. The Nonreportable/small traders were buyers, as they increased their net long position by 937 COMEX contracts...mostly by covering 1,048 short positions.
Doing the math: 8,962 minus 3,488 plus 937 equals 6,411 COMEX contracts, the change in the Commercial net short position.
And before proceeding further, I will point out that the Managed Money traders in silver, as of Tuesday's cut-off, were net short the COMEX futures market by 8,856 COMEX contracts...44.28 million troy ounces...down from the from the 17,818 contracts/89.09 million troy ounces they were short in last week's COT Report.
The Commercial net short position in silver now stands at 45.32 million troy ounces, up from the 13.3 million troy ounces that they were short in last week's COT Report...an increase of 32.0 million troy ounces. That 32.0 million ounce change is obviously the headline number mentioned further up, with the tiny difference being a rounding error.
The Big 8 [which still has two Managed Money traders in it] are short 299.1 million troy ounces in this week's COT Report, down 32.7 million troy ounces from the 331.8 million troy ounces they were short in last Friday's COT Report.
As you know, the Big 8 short position is not a pure commercial trader number because Ted says that there are two Managed Money traders in that category....one in the Big 4 -- and the other in the Big '5 through 8'. Between the two of them, he says they represent about 17,000 contracts/about 85 million troy ounces of silver.
Because of that, the true Big 8 commercial short position, net of the Managed Money traders that are in it, is closer to 299.1-85= approximately 214 million troy ounces...give or take a half a million troy ounces or so...which is huge difference from the calculated gross Big 8 short position...299.1 million troy ounces.
Ted was of the opinion that his raptors, the 31-odd small commercial traders other than the Big 8, did all the selling during the reporting week -- and their long position has now been reduced from around 200 million ounces, down to around 170 million troy ounces.
Always remember that despite their small size, Ted's raptors are still commercial traders in the commercial category.
Here's the 9-year COT chart for silver that puts thing in a longer-term perspective...courtesy of Nick Laird as always. Click to enlarge.
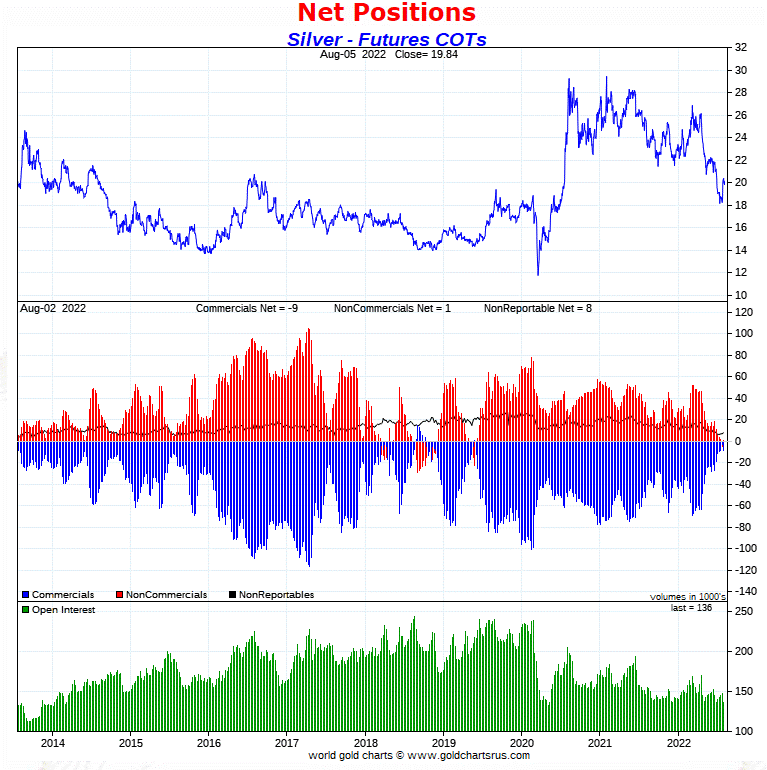
The big take-away from all this as Ted pointed out on the phone yesterday -- and which I wholeheartedly agree with, was the fact that despite the big rally in silver during the reporting week, the Big 8 commercial shorts didn't do a thing, as it was all raptor selling...as we hoped/expected it to be.
This fact leaves the COMEX futures market structure still in wildly off-the-charts bullish territory.
--------
In gold, it was a somewhat different story, as the commercial net short position increased by a hefty 27,143 COMEX contracts, or 27.14 million troy ounces
They arrived at that number by selling 14,307 long contracts -- and they also increased their short position by 12,836 contracts. It's the sum of those two numbers that represents their change for the reporting week.
Under the hood in the Disaggregated COT Report, the Managed Money traders were huge buyers, as they added 4,418 longs, plus covered 30,530 short contracts, for a total change of 34,948 COMEX contracts...buying far more than the commercials sold. The Managed Money traders are now back to being net long gold by a bit.
The reason that happened was because of the other big surprises in this report. Both the Other Reportables and Nonreportable/small traders were big sellers during the reporting week, which I certainly wasn't expecting. The former decreased their net long position by 3,312 COMEX contracts -- and the latter by 4,493 contracts. Why they weren't buyers during this past week's rally is something else that I don't understand.
Doing the math: 34,948 minus 3,312 minus 4,493 equals 27,143 COMEX contracts, the change in the commercial net short position.
As I mentioned a few paragraphs ago, the Managed Money traders have gone from a net short position of 19,093 COMEX contracts/1.91 million troy ounces in the prior week's COT Report, to a net long position of 15,855 COMEX contracts/1.59 million troy ounces in this past week's COT Report.
The commercial net short position in gold sits at 13.56 million troy ounces, up 2.72 million troy ounces from the 10.84 million troy ounces they were short in last Friday's COT Report...which is the change in the headline number mentioned earlier...with the tiny difference being a rounding error.
The short position of the Big 8 traders works out to 17.88 million troy ounces, up a bit from the 17.45 million troy ounces they were short in the prior week's COT Report -- and Ted's back-of-the-envelope calculation showed that the Managed Money traders were short, at most, about 2 million ounces of that amount, if not less.
So that leaves the true commercial component of the Big 8 traders at around 16 million troy ounce -- and that's up around 2.5 million troy ounces from the 13.5 million troy ounces that the true short position of the Big 8 commercial traders was in the prior week's COT Report.
The bottom line here is that Ted feels that his raptors...the small commercial traders other than the Big 8...sold most, but not all of their rather smallish long position during the past reporting week -- and because of that, the Big 4/8 shorts [most likely the Big 4] were forced to step in to prevent the gold price from running away to the upside.
But because of the huge changes in gold in all categories during the reporting week, Ted wanted to sleep on these gold numbers -- and I'm looking forward to his final thoughts on this in his weekly review this afternoon.
Here's Nick Laird's 9-year COT chart for gold, updated with Friday's data. Click to enlarge.
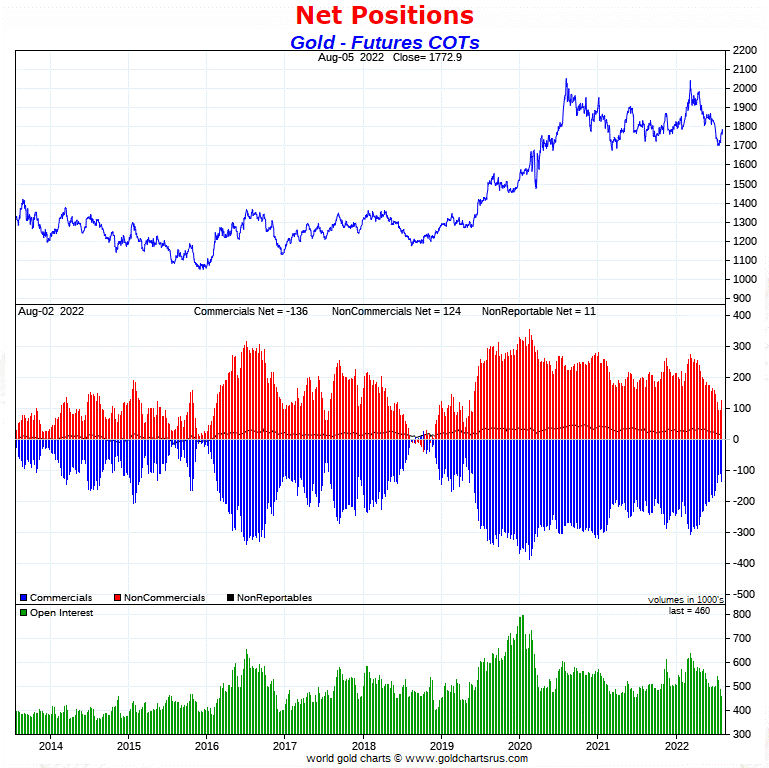
Yes, there was some deterioration in gold from a COT perspective, which appeared to include some fresh shorting by the Big 4/8 commercials. But in the overall, the set-up for a huge move to the upside in gold from a COMEX futures market still remains intact.
And whether or not the commercial traders are prepared to got back on the short side in a big way as the gold price rises, is impossible to tell at the moment.
But in silver, which is an entirely different animal than gold, things have not changed one iota from last week.
---------
In the other metals, the Managed Money traders in palladium decreased their net short position by a hefty 852 COMEX contracts...but are still net short palladium by 1,452 contracts. The commercial traders continue to be the only categories currently net long palladium -- and are so by a lot. In platinum, the Managed Money traders decreased their net short position by a further 3,716 COMEX contracts -- and are still net short platinum in the COMEX futures market by 12,167 contracts. That's also a lot! Platinum continues to be a bifurcated market in the commercial category, with the Producer/Merchants mega net short -- and the Swap Dealers mega net long.
In copper, the Managed Money traders decreased their net short position by 1,994 COMEX contracts -- and are still net short copper by 18,166 COMEX contracts... about 454 million pounds of the stuff. And as in platinum and now silver, copper is a totally bifurcated market in the commercial category. The Producer/Merchants are net short copper by a very decent amount -- and the Swap Dealers are mega net long.
Whether these bifurcated markets mean anything or not, will only be known in the fullness of time. Ted says it doesn't mean anything as far as he's concerned.
In this vital industrial commodity, the world's banks...both U.S. and foreign...are net long 11.9 percent of the total open interest in copper in the COMEX futures market as of yesterday's Bank Participation Report for July...down from the 12.4 percent they were net long in June. So it's the commodity trading houses such as Glencore, along with some hedge funds that are mega net short copper.
---------
Here’s Nick Laird’s “Days to Cover” chart, updated with the COT data for positions held at the close of COMEX trading on Tuesday, July 26. It shows the days of world production that it would take to cover the short positions of the Big 4 — and Big '5 through 8' traders in each physically traded commodity on the COMEX.
I consider this to be the most important chart that shows up in the COT series -- and it always deserves a moment of your time...but now comes with a big caveat attached -- and mentioned in the next paragraph.
Although still important, because the Big 4 and Big 8 short categories in the four precious metals...along with a bunch of other commodities, including copper and WTIC...are contaminated by the short positions of Managed Money traders that are embedded in each, this chart is not at all accurate. The take-away here is that the short positions/days of world production of a lot of these COMEX-traded commodities is far less than what this chart indicates.
For that reason, this chart should be looked at for its 'entertainment value' only -- although the overall 'shape' of the chart would be about right...just not the number of day short held in each by the commercial traders. Most are a lot less than shown...as you'll see below. Click to enlarge.
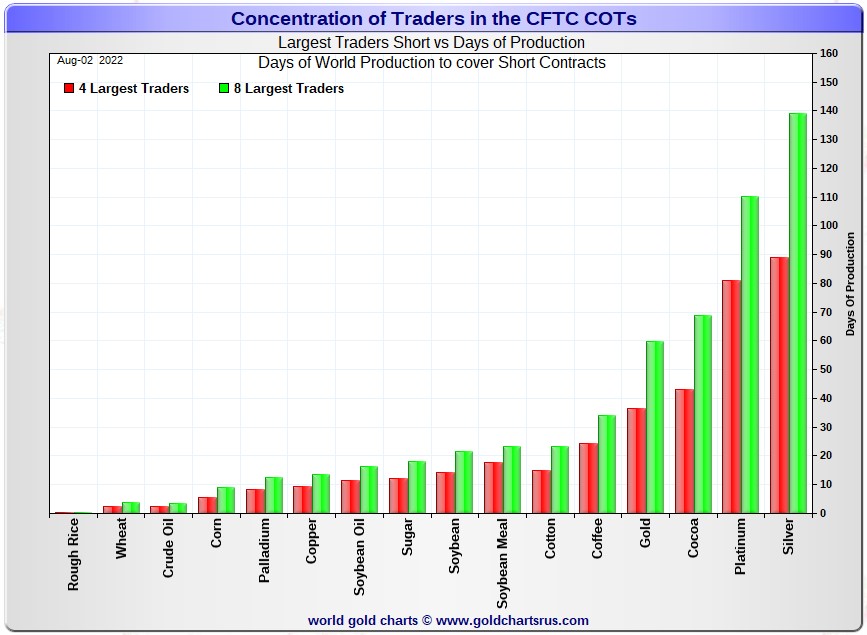
In this week's 'Days to Cover' chart, the Big 4 traders are short about 89 days of world silver production, down 15 days from last week's COT Report. The ‘5 through 8’ large traders are short an additional 50 days of world silver production, unchanged from last Friday's report, for a total of about 139 days that the Big 8 are short -- and obviously down 15 days from last week's COT Report.
[Note: As you know, there's one Managed Money trader in each of the Big 4 and Big '5 through 8' categories. This fact distorts the numbers you see below, and the distortions in silver are now so great, that I'm not going to bother doing much in the way of calculations...just approximations.]
That 139 days that the Big 8 traders are short, represents a bit over four and a half months of world silver production, or 299.1 million troy ounces/59,820 COMEX contracts of paper silver held short by these eight traders...two of which are Managed Money traders.
After subtracting out the positions of the two Managed Money traders...about 17,000 COMEX contracts...the true Big 8 commercial short position is 59.8-17.0=42,800 contracts/214 million troy ounces approximately.
Converting that number to days of world silver production produced a radically different number...about 100 days of world silver production for the Big 8.
This is monstrously lower than the 139 days shows in Nick's graph further up -- and for that reason in silver, it's red and green bars can be disregarded. That can be said of the green and red bars for gold as well -- and the same for platinum, palladium and copper, plus others most likely.
That's why I said that Nick's 'Days to Cover' chart should be viewed for its 'entertainment value' only.
As for Ted's raptors in silver, the 27-odd small commercial traders other than the Big 8, he says their long the COMEX futures market in silver is around 34,000 contracts/170 million troy ounces...down about 33 million from last week, as they sold about 6,500 long contracts during this past reporting week.
The Big 8 traders are short 43.9 percent of the entire open interest in silver in the COMEX futures market, which is down a bit from the 44.9 percent they were short in the last COT report. And once whatever market-neutral spread trades are subtracted out, that percentage would be around the 50 percent mark. In gold, it's 38.9 percent of the total COMEX open interest that the Big 8 are short, up a bit from the 35.8 percent they were short in last Friday's COT Report -- and around the 45 percent mark once their market-neutral spread trades are subtracted out.
But remember that the Big 8 shorts in both gold and silver have two Managed Money traders in their midst, so these are not pure numbers -- and are actually far less than stated above.
In gold, the Big 4 are short 36 days of world gold production, up 2 days from last Friday's COT Report. The '5 through 8' are short 24 days of world production, unchanged from last week -- and the week before...for a total of 60 days of world gold production held short by the Big 8 -- and obviously up 2 days from last Friday's COT Report. Based on these numbers, the Big 4 in gold hold about 60 percent of the total short position held by the Big 8...up about 1 percentage point from last Friday's COT Report.
And because of the presence of two Managed Money traders...one in the Big 4 -- and the other in the Big '5 through 8' category, these numbers are overstated as well. Like in silver, the actual numbers are much smaller.
The "concentrated short position within a concentrated short position" in silver, platinum and palladium held by the Big 4 commercial traders are about 64, 74 and 62 percent respectively of the short positions held by the Big 8...the red and green bars on the above chart. Silver is down about 4 percentage points from last week...platinum is up about 2 percentage point from a week ago. Palladium is up about 1 percentage point week-over-week.
The above numbers are not quite accurate because of the involvement of the Managed Money traders in all four by now...but close enough for our purposes in these particular calculations.
The Big 4/8 traders are still a force to be reckoned with in gold and silver. They were nowhere to be seen in silver during this past reporting week, but did add to their short positions in gold.
As I keep pointing out in this spot every Saturday, the circumstances in silver have been altered by an unimaginable [and monstrously bullish] amount by Ted's discovery of the 1 billion troy ounce physical short position in silver that Bank of America holds in the OTC market...along with the big increase in Goldman's derivatives position in silver in that market, as shown in the latest OCC Report for Q1/2022...which Ted figures is a long position.
The latest OCC Derivatives Report for Q1/2022 was posted about six weeks ago -- and Ted had a lot to say about it in the public domain at that time -- and that's linked here if you wish to refresh your memory. The new OCC report for Q2/2022 won't be out for about seven weeks.
The situation regarding the Big 4/8 commercial shorts in silver, gold [and in platinum for those commercials in the Producer/Merchant category] is still obscene to some extent, but as I mentioned a few paragraphs ago, has decreased drastically as of late.
As Ted has been pointing out ad nauseam forever, the resolution of the Big 4/8 shorts positions will be the sole determinant of precious metal prices going forward...with that resolution getting closer with each passing week.
And, as always, nothing else matters -- and I certainly look forward to what he has to say in his weekly review later this afternoon EDT.
---------
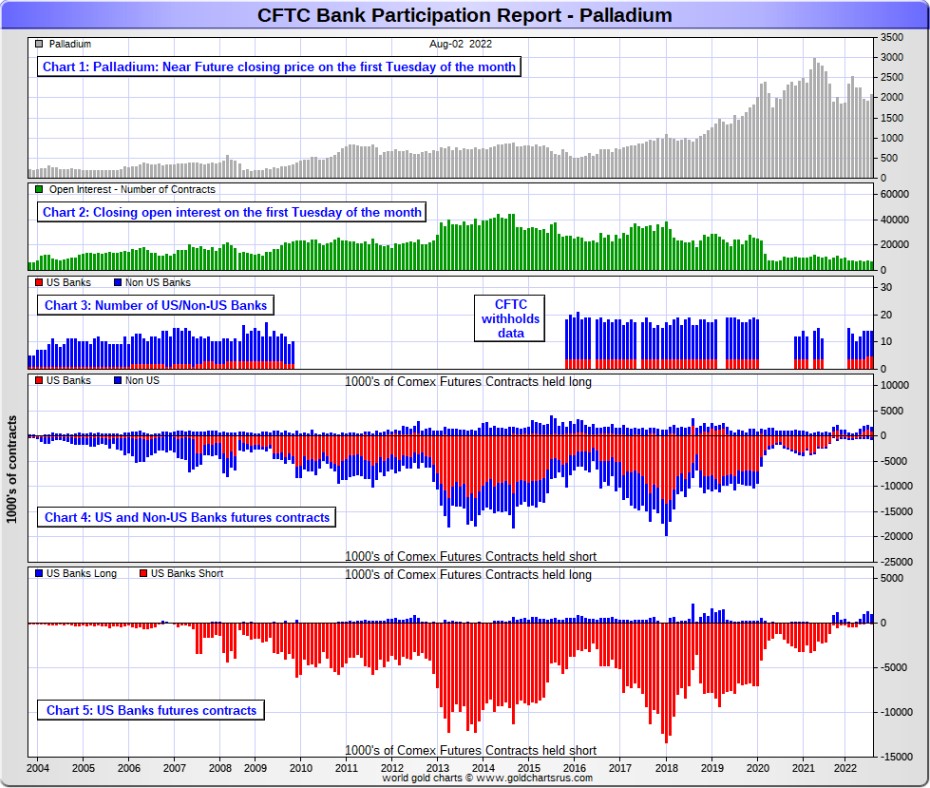
The August Bank Participation Report [BPR] data is extracted directly from yesterday's Commitment of Traders Report. It shows the number of futures contracts, both long and short, that are held by all the U.S. and non-U.S. banks as of Tuesday’s cut-off in all COMEX-traded products. For this one day a month we get to see what the world’s banks are up to in the precious metals.
They’re usually up to quite a bit -- and that's what I was expecting. However, except for some minor improvements in gold...plus tiny bits in silver and platinum...there wasn't a lot to see.
[The August Bank Participation Report covers the time period from July 6 to August 2 inclusive.]
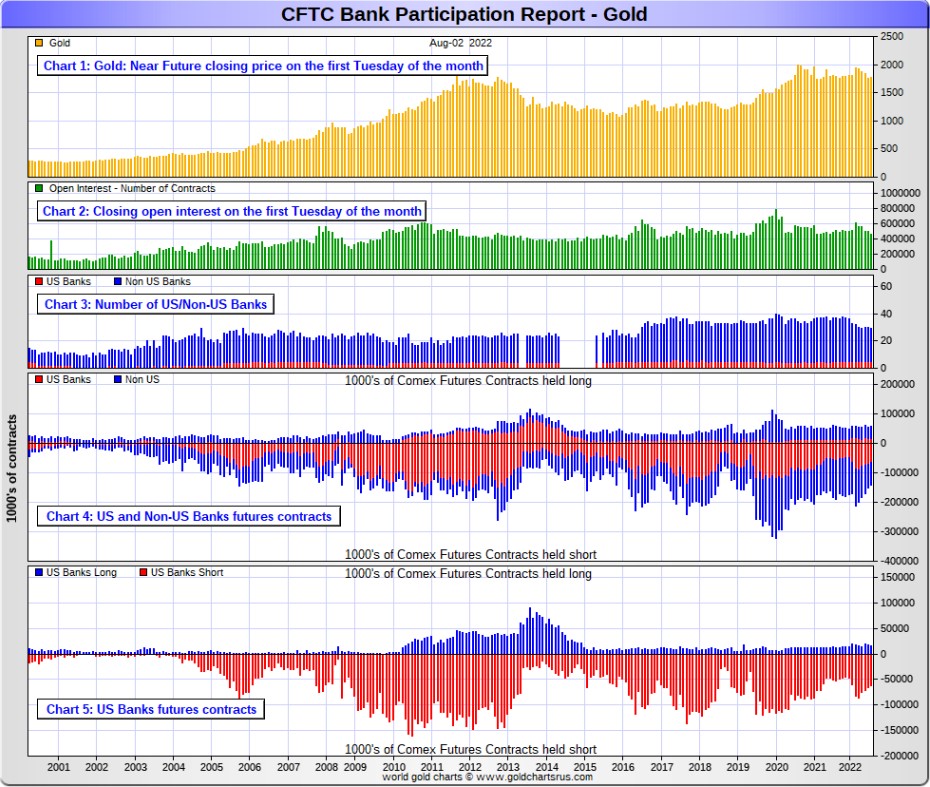
In gold, 5 U.S. banks are net short 46,039 COMEX contracts in the August BPR. In July’s Bank Participation Report [BPR] these same 5 U.S. banks were net short 49,610 contracts, so there was a decrease of only 3,571 COMEX contracts month-over-month. I was expecting a far higher number that that, but it was their fourth monthly decrease in a row.
Citigroup, HSBC USA, Bank of America and Morgan Stanley would most likely be the U.S. banks that are short this amount of gold. I still have my usual suspicions about the Exchange Stabilization Fund, although if they're involved, they are most likely just backstopping these banks.
Also in gold, 24 non-U.S. banks are net short 39,480 COMEX gold contracts. In July's BPR, 25 non-U.S. banks were net short 45,264 contracts...so the month-over-month change shows a decrease of 5,784 COMEX contracts...the fifth monthly decrease in a row -- and down from the 92,025 contracts they were short in the March BPR.
These are the kinds of decreases that I've been expecting to see for the U.S. Banks, but it hasn't happened.
At the low back in the August 2018 BPR...these same non-U.S. banks held a net short position in gold of only 1,960 contacts -- so they've been back on the short side in an enormous way ever since.
I suspect that there are at least three large banks in this group, HSBC, Barclays and Standard Chartered. I still harbour suspicions about Scotiabank/Scotia Capital, Dutch Bank ABN Amro, French bank BNP Paribas, plus Australia's Macquarie Futures. Other than that small handful, the short positions in gold held by the vast majority of non-U.S. banks are immaterial and, like in silver, have always been so.
As of this Bank Participation Report, 29 banks [both U.S. and foreign] are net short 18.6 percent of the entire open interest in gold in the COMEX futures market, which is down a tiny bit from the 19.1 percent that 30 banks were net short in the July BPR.
Here’s Nick’s BPR chart for gold going back to 2000. Charts #4 and #5 are the key ones here. Note the blow-out in the short positions of the non-U.S. banks [the blue bars in chart #4] when Scotiabank’s COMEX short position was outed by the CFTC in October of 2012. Click to enlarge.
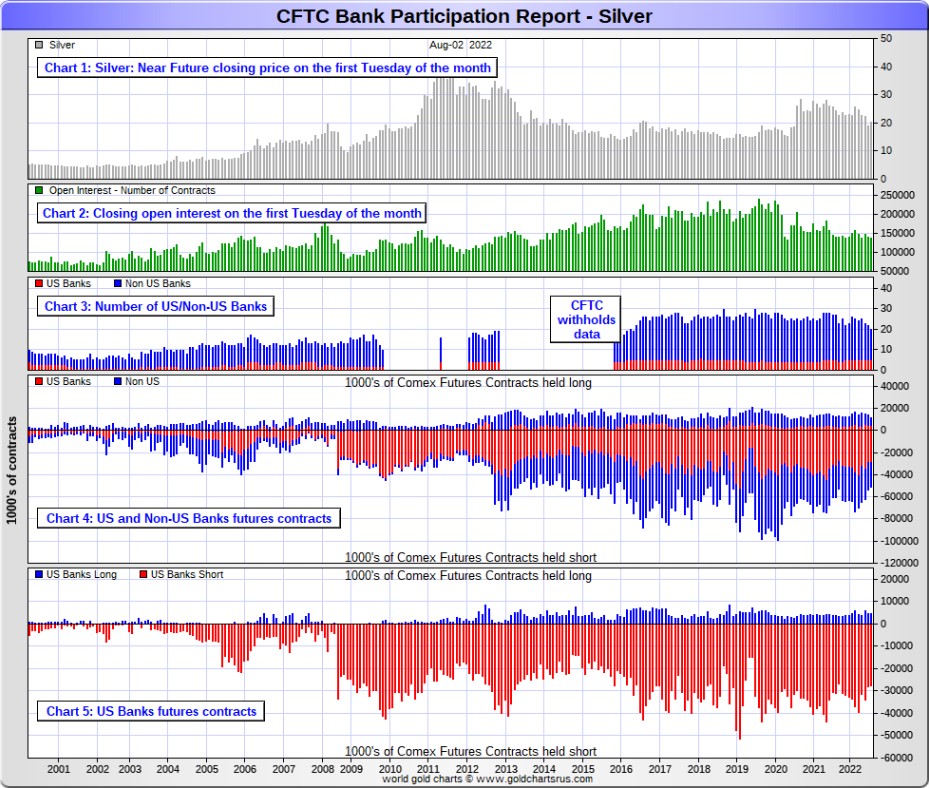
In silver, 5 U.S. banks are net short 23,247 COMEX contracts in August's BPR. In July's BPR, the net short position of these same 5 U.S. banks was 23,444 contracts, which is down an insignificant 197 contracts from a month ago. You'd have to go back to April of 2018 to find a lower number than this one.
The biggest short holders in silver of the five U.S. banks in total, would be Citigroup, HSBC USA, Bank of America, Morgan Stanley...and maybe Goldman Sachs...but not JPMorgan according to Ted. And, like in gold, I have my suspicions about the Exchange Stabilization Fund's role in all this...although, also like in gold, not directly.
Also in silver, 15 non-U.S. banks are net short 16,048 COMEX contracts in the August BPR...which is down only 676 contracts from the 16,724 contracts that 17 non-U.S. banks were net short in the July BPR...the fifth month in a row of decreases. You'd have to go back to October of 2017 to find a lower number.
I would suspect that HSBC and Barclays hold a goodly chunk of the short position of these non-U.S. banks...plus some by Canada's Scotiabank/Scotia Capital still. I'm not sure about Deutsche Bank... but now suspect Australia's Macquarie Futures. I'm also of the opinion that a number of the remaining non-U.S. banks may actually be net long the COMEX futures market in silver. But even if they aren’t, the remaining short positions divided up between these other 10 or so non-U.S. banks are immaterial — and have always been so.
As of August's Bank Participation Report, 20 banks [both U.S. and foreign] are net short 28.9 percent of the entire open interest in the COMEX futures market in silver— up a hair from the 28.5 percent that 22 banks were net short in the July BPR. And much, much more than the lion’s share of that is held by Citigroup, HSBC, Bank of America, Barclays, Scotiabank -- and possibly one other non-U.S. bank...all of which are card-carrying members of the Big 8 shorts.
[The reason for the percentage increase from 28.5 to 28.9%, despite the real decreases in both U.S. and non-U.S. banks during the reporting month, was the fact that total open interest in silver dropped a bunch month/month, which affects the percentage calculation of the total. But the overall improvements for each group of banks during July was the real deal.]
I'll point out here that Goldman Sachs, up until late last year, had no derivatives in the COMEX futures market in any of the four precious metals. But they did show up in the last two OCC Reports. Now they have a $5.96 billion position, virtually all in silver -- and Ted thinks they're long silver in the OTC market.
Here’s the BPR chart for silver. Note in Chart #4 the blow-out in the non-U.S. bank short position [blue bars] in October of 2012 when Scotiabank was brought in from the cold. Also note August 2008 when JPMorgan took over the silver short position of Bear Stearns—the red bars. It’s very noticeable in Chart #4—and really stands out like the proverbial sore thumb it is in chart #5. But, according to Ted, as of March 2020...they're out of their short positions, not only in silver, but the other three precious metals as well. Click to enlarge.
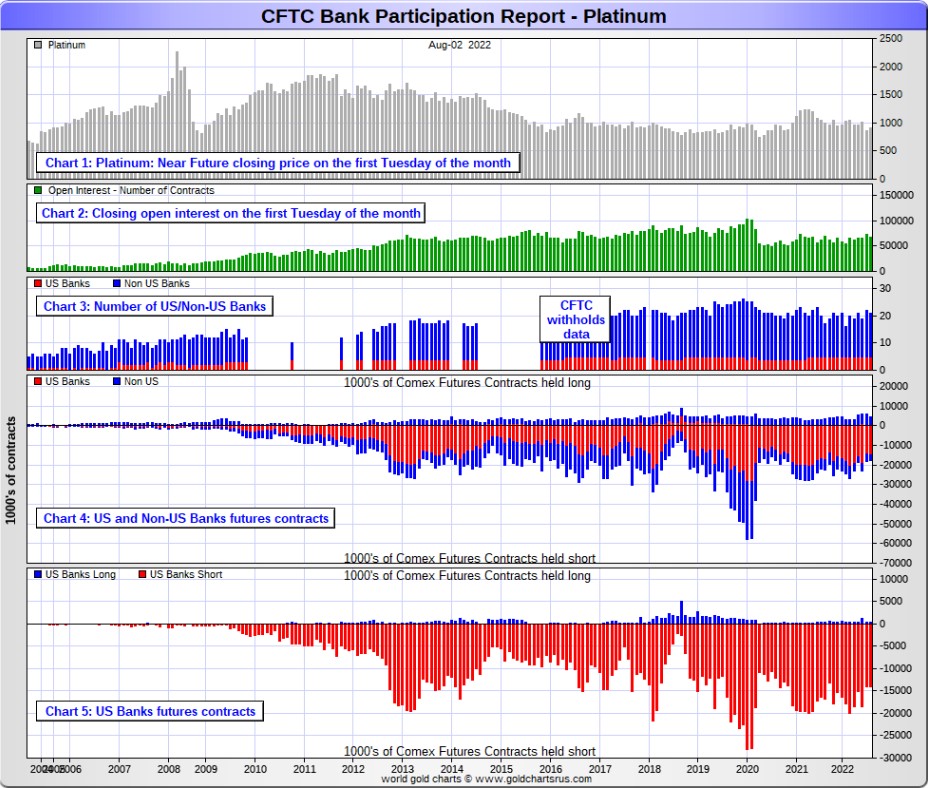
In platinum, 5 U.S. banks are net short 13,698 COMEX contracts in the August Bank Participation Report, which is up a paltry 159 contracts from the 13,539 COMEX contracts that these same 5 U.S. banks were short in the July BPR. This is still the smallest net short position that these U.S. banks have held since December of last year -- and before that, October of 2020.
At the 'low' back in July of 2018, these U.S. banks were actually net long the platinum market by 2,573 contracts. So they have a very long way to go to get back to just market neutral in platinum...if they ever intend to, that is.
Also in platinum, 16 non-U.S. banks are net long 597 COMEX contracts in the August BPR, which is down 907 contracts from the 1,504 contracts that 17 non-U.S. banks were net long in the July BPR.
So from a U.S./non-U.S. bullion bank perspective, this is a bifurcated market.
[Note: Back at the July 2018 low, these same non-U.S. banks were net short 1,192 COMEX contracts in platinum.]
And as of August's Bank Participation Report, 21 banks [both U.S. and foreign] are net short 19.2 percent of platinum's total open interest in the COMEX futures market, which is up a bit from the 16.5 percent that 22 banks were net short in July's BPR.
But it's the U.S. banks in this bifurcated market that are on the short hook big time -- and the real price managers. They have little chance of delivering into their short positions, although a very large number of platinum contracts have already been delivered during the last couple of years. But that fact, like in both silver and gold, has made no difference whatsoever to their paper short positions. The situation for them [the U.S. banks] in this precious metal is as almost as equally dire in the COMEX futures market as it is with the other two precious metals...silver and gold...particularly the former.
Here's the Bank Participation Report chart for platinum. Click to enlarge.
In palladium, 5 U.S. banks are net long 891 COMEX contracts, down 366 contracts from the 1,257 COMEX contracts that these same 5 U.S. banks were net long in July's BPR.
Also in palladium, 9 non-U.S. banks are net long 92 COMEX contracts in the August BPR, down 249 contracts from the 341 contracts that these same 9 non-U.S. banks were net long in July.
Except in February's Bank Participation Report, these non-U.S. banks have been net long palladium for more than two years now.
And as I've been commenting on for almost forever, the COMEX futures market in palladium is a market in name only, because it's so illiquid and thinly-traded. Its total open interest in yesterday's COT Report was only 6,945 contracts...compared to 68,266 contracts of total open interest in platinum...136,267 contracts in silver -- and 459,649 COMEX contracts in gold.
The only reason that there's a futures market at all in palladium, is so that the Big 8 commercial traders can control its price. That's all there is, there ain't no more.
As of this Bank Participation Report, 14 banks [both U.S. and foreign] are net long 14.1 percent of the entire COMEX open interest in palladium...compared to the 21.7 percent of total open interest that these same 14 banks were net long in July's BPR.
And because of the small numbers of contracts involved, along with a tiny open interest, these numbers are pretty much meaningless.
But, having said that, for the last almost three years in a row now, the world's banks have not been involved in the palladium market in a material way. And with them now net long, it's all hedge funds and commodity trading houses that are left on the short side.
Here’s the palladium BPR chart. Although the world's banks are now net long at the moment, it remains to be seen if they return as big short sellers again at some point like they've done in the past. Click to enlarge.
Excluding palladium for obvious reasons -- and platinum in the non U.S. bank category...only a small handful of the world's banks, most likely four or so in total -- and mostly U.S-based, except for HSBC, Barclays and maybe Standard Chartered... continue to have meaningful short positions in the precious metals. It's a near certainty that they run this price management scheme from within their own in-house/proprietary trading desks...although it's a given that some of their their clients are short these metals as well.
The futures positions in silver and gold that JPMorgan holds are immaterial -- and have been since March of 2020...according to Ted Butler. And what net positions they might hold, would certainly be on the long side of the market. It's the new 7+1 shorts et al. that are on the hook in everything precious metals-related.
And as has been the case for years now, the short positions held by the Big 4/8 traders/banks is the only thing that matters...especially the short positions of the Big 4 -- and how this is ultimately resolved [as Ted said earlier] will be the sole determinant of precious metal prices going forward.
The Big 8 shorts, along with Ted's raptors...the small commercial traders other than the Big 8 commercial shorts...continue to have an iron grip on their respective prices -- although things have changed a lot in that regard over the last month. The Big 4/8 shorts have engineered prices lower in order to cover as many of their short positions as possible -- and they've been most successful at it...with the only disappointment being the small decrease in the short position in gold held by the U.S. banks in this week's Bank Participation Report.
That 'iron grip' will persist until they either voluntarily give it up...or are told to step aside, as it now appears that there's no chance that they will ever get overrun. If that possibility had ever existed in reality, it would have happened already. However, considering the current state of affairs in the world today -- and the physical shortage in silver, I suppose one shouldn't rule it out entirely.
I have about an average number of stories, articles and videos for you today.
----------
CRITICAL READS
Payrolls increased 528,000 in July, much better than expected in a sign of strength for jobs market
Hiring in July was far better than expected, defying multiple other signs that the economic recovery is losing steam, the Bureau of Labor Statistics reported Friday.
Non-farm payrolls rose 528,000 for the month and the unemployment rate was 3.5%, easily topping the Dow Jones estimates of 258,000 and 3.6%, respectively.
The unemployment rate is now back to its pre-pandemic level and tied for the lowest since 1969, though the rate for Blacks rose 0.2 percentage point to 6%.
Wage growth also surged higher, as average hourly earnings jumped 0.5% for the month and 5.2% from the same time a year ago. Those numbers add fuel to an inflation picture that already has consumer prices rising at their fastest rate since the early 1980s. The Dow Jones estimate was for a 0.3% monthly gain and 4.9% annual increase.
More broadly, though, the report showed the labor market remains strong despite other signs of economic weakness.
“There’s no way to take the other side of this. There’s not a lot of, ‘Yeah, but,’ other than it’s not positive from a market or Fed perspective,” said Liz Ann Sonders, chief investment strategist at Charles Schwab. “For the economy, this is good news.”
That's if you believe that number from the BLS. This story appeared on the cnbc.com Internet site at 8:30 a.m. EDT on Friday morning -- and was updated about seven and a half hours later. I thank Swedish reader Patrik Ekdahl for today's first story -- and another link to it is here. The worthwhile ZeroHedge spin on this is headlined "Something Snaps in the Job Market: Multiple Jobholders Hit All-Time High as Unexplained 1.8 Million Jobs Gap Emerges" -- and was posted on their website at 10:25 a.m. EDT on Friday morning. I thank Brad Robertson for that one.
----------
Consumer Credit Surged in June, 2nd Largest Monthly Increase Ever
Last month we began to see the first signs of the consumer cracking as credit numbers slowed drastically after months of spend-heavy consumption amid tumbling real wages.
One month late and June data, released today by The Fed, show that consumer credit rebounded dramatically with an additional $40.154 billion piled on (well above the expectation of a $27 billion rise). That is the second largest monthly spike in consumer credit in history. Click to enlarge.
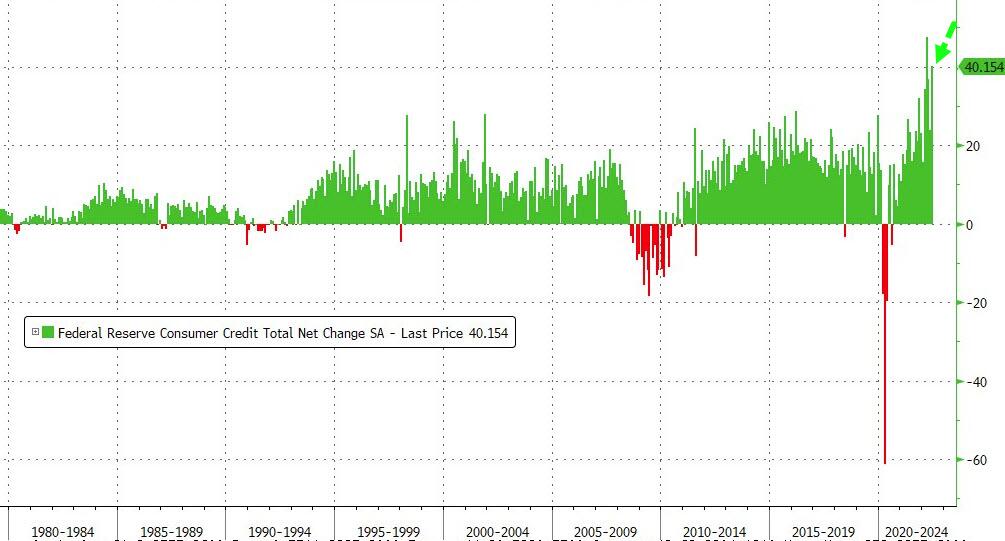
Non-revolving debt - funds less discretionary items such as cars and college education - surged by a record $25.35 billion in June...
Revolving consumer debt (i.e. credit card usage) rebounded in June with an increase of $14.799 billion.
Bottom line: The renewed reliance on revolving debt to maintain lifestyles in June (when gas prices were soaring to record highs) suggests the consumer is anything but 'happy' (as sentiment surveys make very obvious). What's worse is that (despite today's anomalous surge in payrolls), surging initial jobless claims from a new wave of corporate layoffs combined with soaring inflation - all at a time when most marginal credit cards are maxed out - will make the pain across U.S. consumers unbearable, as it will come just as most households are tapped out and no longer have dry powder on their credit card for discretionary purchases.
Savings are tapped out and credit cards are maxed out!
In short, the recession which unofficially started in Q1 and worsened in Q2, is about to get much worse in Q3 (as the Composite PMI suggested this week) when the key support pillar of the U.S. economy, consumer spending which accounts for 70% of GDP, goes into reverse now that maxed out credit cards have to finally be repaid.
This brief 4-chart Zero Hedge article put in an appearance on their website at 3:09 p.m. on Friday afternoon EDT -- and another link to it is here. Gregory Mannarino's most always "Adult" rated post market close rant from yesterday is linked here -- and comes courtesy of Brad Robertson.
---------
Indefensible Neutral Rate Doctrine -- Doug Noland
Bloomberg’s David Westin (Wall Street Week, July 29, 2022): “What do you economists do when you put together these neutral rates?”
Larry Summers: “I think Jay Powell said things that, to be blunt, were analytically indefensible. He claimed twice in his press conference that the Fed was now at the neutral interest rate – calling it 2.5%. It’s elementary that the level of the neutral interest rate depends upon the inflation rate. We’ve got on the most quoted measure a 9.1% inflation measure – if you extrapolate it off core it’s four or five percent inflation. There is no conceivable way that a 2.5% interest rate in an economy inflating like this is anywhere near neutral. And if you think it is neutral, you are misjudging the posture of policy in a fundamental way. So, I was very sorry to hear him say that and, frankly, surprised. He said back in 2018 that the Fed was approaching the neutral interest rate at a time when the inflation rate was 1.9%.
How he could be saying the same thing today, when the inflation rate is where it is, is inexplicable to me, and it’s the same kind of, to be blunt, wishful thinking that got us into the problems we have now with the use of the term ‘transitory.’ So, I hope the rigor of the economic analysis at the Federal Reserve is going to step up.”
Powell provides an easy target these days. But when it comes to the “neutral rate” discussion, the entire economic community is implicated. The concept has never been on sound footing. As far as I’m concerned, the entire concept of calibrating monetary policy based upon some nebulous “neutral rate” is indefensible. Analytical quicksand.
Reliance on some “neutral rate” to calibrate monetary policy is deeply flawed doctrine. The Fed’s assumptive 2.5% neutral rate may have seemed reasonable during the recent “Risk Off” backdrop. In the current squeeze rally environment, however, it is indefensible – or, in the words of Mohamed El-Erian, “comical.” Fed talk of reaching the neutral rate only stokes risk embracement and resulting loose conditions, thus countering previous tightening measures.
Friday’s much stronger-than-expected (528k added) July payrolls data underscores another Fed dilemma. Bubble markets are more fragile these days than the underlying economy. Over 900,000 jobs were created during the past two months.
According to Tuesday’s “JOLTS” report, there remain 10.7 million job openings. It’s also worth noting Friday’s much stronger-than-expected June Consumer Credit data. At $40 billion, the increase in Consumer Credit was second only to March’s $47 billion splurge.
Ominously, 10-year Treasurys have not been intimidated by hot inflation, a hot jobs market, or a Fed pressured to impose more aggressive tightening measures. Yields are instead consistent with the unfolding synchronized bursting of scores of global Bubbles. Could the situation in China be more alarming? Country Garden yields surpassed 50% this week, as the historic developer meltdown runs unabated. Vanke CDS surged another 255 to 747 bps – up from 300 bps in June and 100 bps in September.
I can't accept that collapsing Chinese Bubbles and such a belligerent approach with Taiwan are coincidental.
Fed policy, the markets, the U.S. and Russia, China and the U.S., China and Japan, Russia and Europe. The whole world seems on a collision course. Little wonder Treasuries are readily dismissing inflation and Fed tightening, apparently content to count down the months until rate cuts and the restart of QE.
As you're more than aware, Doug's weekly commentary, posted on his website shortly after midnight PDT, is always a must read for me -- and another link to this week's is here.
----------
Argentina Vows Not to Go Full Weimar, Will Stop Printing Money Amid 60% Inflation
Hours after Argentina's new Minister of Economy Sergio Massa was sworn into office, he pledged to stop printing money in an attempt to halt a spiraling currency crisis which has seen inflation hit 60% - and has been projected to reach 90% by the end of this year.
According to the Buenos Aires Times, Massa's economic roadmap also focuses on boosting exports, reducing the country's fiscal deficit, and refilling the central bank's severely depleted reserves.
Protests have erupted across the country over the last several months, as citizens are demanding that their center-left government reinstate various subsidies, and reconsider cutting more - such as the country's notorious welfare program, which has grown to 22 million Argentinians receiving assistance amid a 43% unemployment rate.
The country's deteriorating economic picture has left it cut off from international capital markets as the Fernández administration has relied on printing money to cover its chronic fiscal debt.
As TheEpoch Times noted earlier in the week, the country’s state funded programs extend to nearly every aspect of the economy, from wages to utilities, education, and health care.
Harry Lorenzo, chief finance officer of Income Based Research, told The Epoch Times the spending habits of Argentina’s government are at the root of the escalating problem.
This Zero Hedge news item appeared on their Internet site at 9:20 p.m. on Thursday evening EDT -- and another link to it is here.
-----------
The E.U. Has Begun its Retreat. “First Steps in Unraveling Energy and Food Sanctions on Russia”
The EU has begun its retreat: It has taken the first steps in unraveling energy and food sanctions on Russia. Will other steps follow? Or will the pan-West, Russia-phobic axis strike back with further belligerence? Nothing is settled yet, but were the retreat to continue, and the separate Ukraine grain export accord hold together, it will be generally good news for the Region.
The bigger issue is of whether – even a more substantive EU retreat ensues – this will make a difference to the larger economic paradigm. Unfortunately, the answer is very probably not.
The EU’s seventh package of sanctions on Russia, whilst ostensibly posing as an increase in sanctions (which it is for certain gold imports into the EU that have no real impact on Russia) – and with a small extension of the list of controlled (mainly tech) items – the package represents, in reality, a concealed retreat.
For, as one digs deeper, the package substantially alleviates sanctions in key areas. Firstly, the package ‘clarifies’ aviation measures (Comment: Though opaquely worded, this passage seems to be quietly permitting the export of spare Airbus parts to Russian aviation fleets). The package says that to avoid any negative consequences for food and energy security around the world – and for clarity – the EU extends the exemption to transport of agricultural products, (food) and fertiliser exports and the transport of oil from Russia to third countries. Furthermore, it exempts third party purchases of pharmaceutical and medical products from Russia.
The EU likes to claim that their sanctions never included food and fertilisers, and that the suggestion that they did, is propaganda. Their argument, however, is disingenuous. The EU sanctions’ legalistic wording was so open, so opaque, that it was not clear whether they did, or didn’t. Trading companies understandably feared retroactive fines for breaking sanctions. They had the bitter experience of the U.S. Treasury refusing to say explicitly what was allowed, and which not; and in the case of Iran, out of the blue, hitting European banks with monstrous fines.
The explicitness matters: Food, agricultural products and fertiliser transported to Third Countries are exempt from sanctions. States like Egypt can now import wheat from Ukraine, Russia – and effectively from Belarus too, (since it now forms a single market with Russia).
Equally, the third country transport of Russian oil to states such as China, India, Iran, and Saudi Arabia are now explicitly exempt.
This commentary by former British diplomat Alastair Crooke was posted on the globalresearch.com Internet site on Wednesday -- and I've been saving it for today's column for length and content reasons. I thank Roy Stephens for pointing it out -- and another link to it is here. Another article on this topic appeared on the oilprice.com Internet site on Thursday -- and it's headlined "Why the West is Easing Its Sanctions on Russia" -- and I found it on Zero Hedge.
------------
Maduro is using Queen Elizabeth's letters in fight over Venezuelan gold
Venezuela’s government has produced letters apparently signed by Queen Elizabeth II to bolster its claim to more than $1 billion of gold stored in the Bank of England.
The diplomatic correspondence is evidence that the U.K. recognized Nicolas Maduro as Venezuela’s president, said Calixto Ortega, the head of Venezuela’s central bank.
This undermines a ruling by a judge in London last month that denied Maduro’s administration control of the bullion, Ortega said Thursday, in a rare interview. The U.K.’s issuance of visas to Maduro’s officials also strengthens the government’s case, Ortega added.
Opposition figure Juan Guaido is also trying to claim control of the gold in the long-running legal battle, after the U.K. recognized him as Venezuela’s president in 2019. The Maduro government has said it will appeal the most recent court ruling.
“Three letters signed by the Queen make for an official position,” Ortega said in Paris, while returning to Caracas from London where he discussed the issue with his lawyers.
The U.K. Foreign Office didn’t immediately reply to a written request for comment.
This Bloomberg story from Thursday showed up on the bnnbloomberg.com Internet site -- and I found it embedded in a GATA dispatch. Another link to it is here.
----------
The Photos and the Funnies
Still working our way slowly up the main drag at the historic and now restored gold mining town of Barkerville on September 5. There were lots of people walking around in period costumes -- and the lady in the first shot was one of them. Photos three and four were taken in the same place -- and it took two shots to get it all in, even with my 14mm ultra-wide angle lens. The critters mounted above the bar in the third shot are mountain caribou. They used to plentiful at one time, but no longer -- and are now on the endangered species list.
-----------
The WRAP
"Understand this...things are now in motion that cannot be undone." ~ Gandalf the White
-------------
Today's pop 'blast from the past' dates for 1974...you can do the math, as it's depressing. I've feature this American rock group before, but never this song, so here it is now. It was the most successful single of the group's career, peaking at number 4 on the Billboard Hot 100 in the summer of that year.
They described it as a "catchy, almost tango-like tune." Cash Box said that the "strong accent on harmonies with keyboard and percussion dominating the musical end make for a very entertaini
ng track."
It has all those things for sure -- and the link is here. Of course there's a bass cover to this -- and it's far trickier and intricate than I first thought, with lots of key changes. That's linked here.
Today's classical blast from the past is an orchestral work that's not programmed as often as it should be, as it requires a huge string section to do it justice. It's Symphonie fantastique: Episode in the Life of an Artist … in Five Sections, Op. 14 by French composer Hector Berlioz in 1830. He specified at least 15 1st violins, 15 2nd violins, 10 violas, 11 celli and 9 basses on the score.
Berlioz put a great deal of emotion into the piece, exploring the extremities of many ends of the emotional spectrum. He wanted people to understand his intentions behind it as they were the driving factor behind each movement and the story he attaches to the different parts of the piece. Berlioz said "For this reason I generally find it extremely painful to hear my works conducted by someone other than myself."
Here's the Orchestre philharmonique de Radio France conducted by Maestro Myung-Whun Chung in a live recording on 13 September 2013. It's luscious...as smooth as cream poured on satin -- and certainly would be with that many string players. It's the biggest orchestra I've ever seen on any stage. The link is here.
------------
Right on cue with the b.s. BLS non-farm payroll number release at 8:30 a.m. EDT in Washington, the powers-that-be rammed the dollar index higher -- and hammered three of the four precious metals sharply lower.
It's a movie that we've seen countless times before, but was so obvious this time that even Ray Charles could have seen it, if he was still alive.
All three...gold, silver and platinum...recovered strongly after their 9:15 a.m. New York lows were set -- and it was equally obvious that gold and silver would have closed up on the day, if allowed. Of the three, only platinum was allowed that luxury -- and it, not by much.
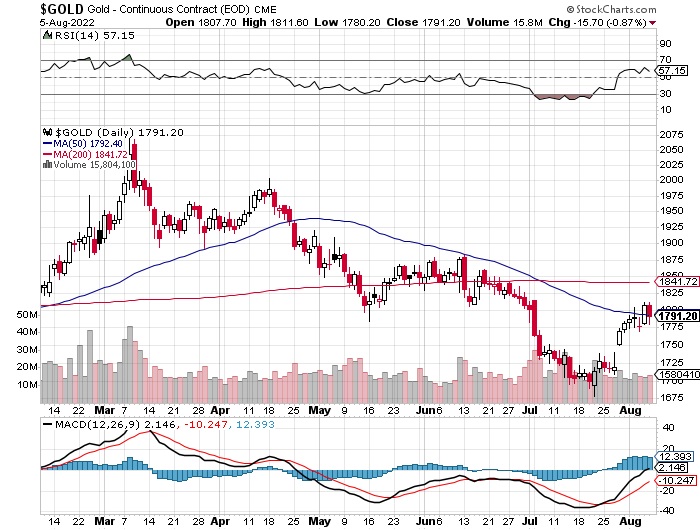
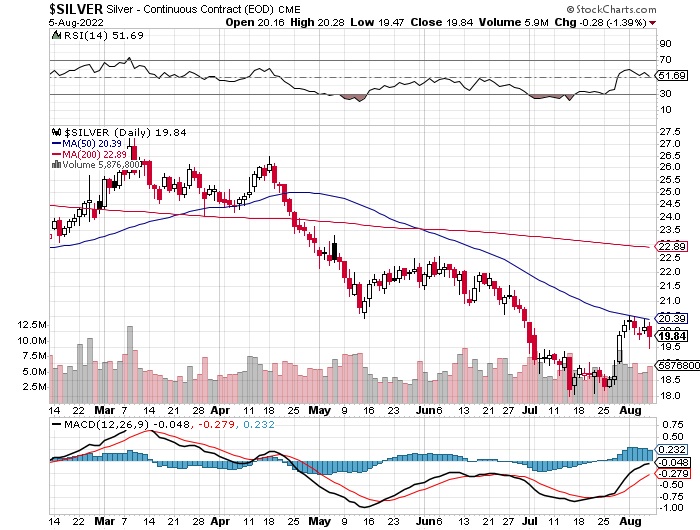
Gold was closed a hair below its 50-day moving average -- and silver 55 cents below it. This is the fifth straight day that the commercial traders have prevented silver from breaking above its 50-day moving average. The last time it saw any moving average that mattered was the third week of April when it was closed below its 200-day -- and its 50-day two days prior to that.
And although platinum closed a tad higher in the spot month, it was closed down on the day by a hair in its current front month, which is October.
Palladium, in its thinly traded and illiquid fashion, continued on its merry way, but even it ran into 'something' about ten minutes after the 10 a.m. EDT afternoon gold fix in London.
"Da boyz" were everywhere they had to be in everything precious metals-related yesterday, as they wanted no safe harbour available that wasn't fiat of one kind or another.
However, it should be mentioned once again that despite the pounding that silver and gold took in the COMEX futures market, their respective equities only closed lower by less than one percent on average -- and finished the day on a strong up tick.
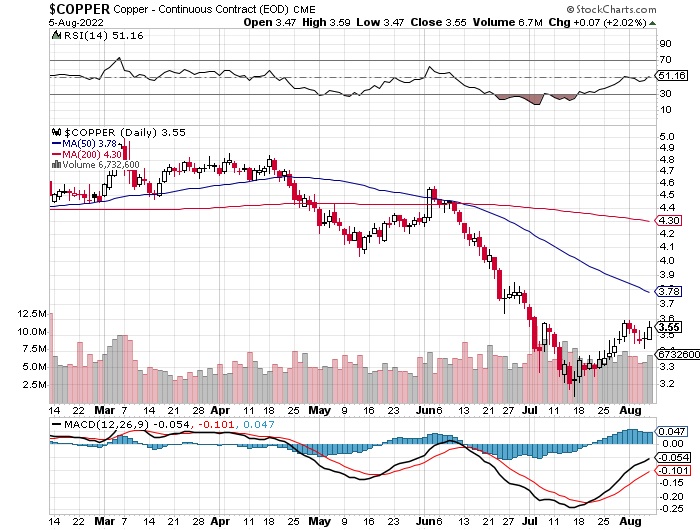
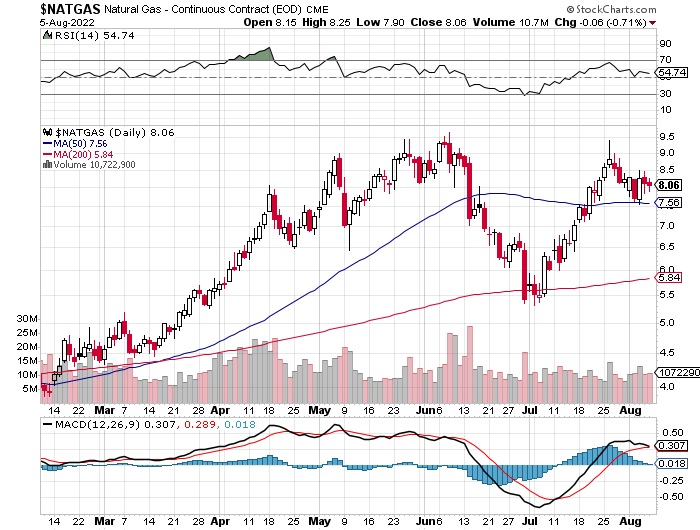
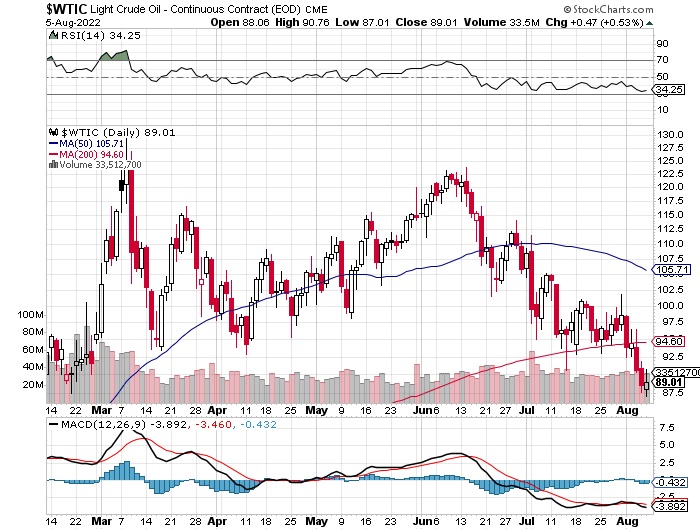
Copper closed higher by 7 cent, finishing the Friday trading session at $3.55/pound -- and still some distance below any moving average that matters. Natural gas [chart included] didn't do much, closing lower by 6 cents at $8.06/1,000 cubic feet. WTIC was up a tiny 47 cents, closing at $89.01/barrel. It's been below its 200-day moving average for five consecutive days now.
Here are the 6-month charts for the Big 6+1 commodities, thanks to stockcharts.com as always -- and yesterday's price action up to the 1:30 p.m. COMEX close should be noted, if you have the interest. Click to enlarge.
Although neither Ted or I were happy to see the big commercial shorts show up on the sell side in gold during the reporting week, it's far from the end of the world.
As he pointed out on the phone yesterday -- and I mentioned further up, his concern lies with silver -- and the fact that the big commercial shorts sat on their hands during the reporting week was exactly as expected. It was his raptors, the small commercial traders other than the Big 8 shorts, that did the heavy lifting during the reporting week. That was expected as well.
He calculated that they sold around 30,000 COMEX contracts last week -- and still have 170,000 contracts that they still hold long. They'll be selling those all the way up once this rally is allowed to develop more legs.
Once they've sold all the longs they're going to, only then will we find out if the big shorts will return as short sellers.
I doubt it -- and so does he, as they've moved heaven and earth to extricate themselves from the short side since gold and silver topped out when the LME nickel contract blew up on March 8.
Why would they have gone through the entire process of their own engineered price declines we've seen since, only to re-short when these rallies really get going?
Ted has mentioned on several occasions that the remaining short positions held by the Big 4/8 commercials are now small enough that they can be easily compensated for in other markets, like in options...or in OTC transactions. Their gains there will certainly cover their losses in the COMEX futures market.
Although these rallies have 'stalled', it's not the end of the world...as I just stated above.
These guys have a plan to get out of their short positions, that so far they've executed to perfection, much to our dismay. They certainly have an end game scenario in mind that we're just not privy to...nor do we have a hint of any kind of time line as to when the end will come.
But as we already know, this price management scheme in the precious metals, particularly in silver, is long past its 'best before' use date. The end of fifty plus years of price management since Nixon "temporarily" took the U.S. off the gold-exchange standard takes planning, plus a long lead time.
The powers-that-be in the bullion banking business, the B.I.S., the U.S. Treasury and most likely the Exchange Stabilization Fund, along with the CME Group and CFTC, are proceeding at their own pace with whatever plan they have...as they're all up to their necks in this behind scenes.
There's nothing we can do except continue to wait it out -- and keep stacking silver. Because when this thing does end, it won't occur in a news vacuum, as I've stated for years. We'll certainly end up with Keith Neumeyer's "triple digit silver" in very short order -- and yes, I do have the T-shirt.
I'm still "all in" -- and I'll see you here on Tuesday.
Ed
Gold and Silver Digest
SUBSCRIBE: https://edsteergoldsilver.com/
Ed Steer’s Daily Analysis of the Gold and Silver Markets
After eight years of writing about the precious metals for Casey Research, the folks at Stansberry & Associates—who just recently purchased controlling interest in the company—decided that my ‘niche market’ column didn’t fit into their plans.
Since the time that Casey Research was kind enough to offer me a stand-alone column, it became their most highly-rated blog almost from the outset—and has remained that way up to this date...
https://edsteergoldsilver.com/
********
More from Silver Phoenix 500


