A Big Reason Why Silver Is Set To Soar


 There is only so much value in the world economy…and it is split between all the different assets (like gold, silver, stocks, bonds, commodities, etc.) where value resides.
For silver and gold to rise significantly, relative to other instruments of value, value will have to be diverted away from those other competing instruments. The stock market, in particular, has been the biggest obstacle to a rise in precious metals, due to it sucking up most of the available value on global markets.
For most of the silver and gold bull market since about 2001, these competing instruments have, in fact, also been experiencing their own bull market. For example, see the following chart (from stockcharts.com) of the CRB vs Silver, since 2001, for how the commodities and silver have been moving together:
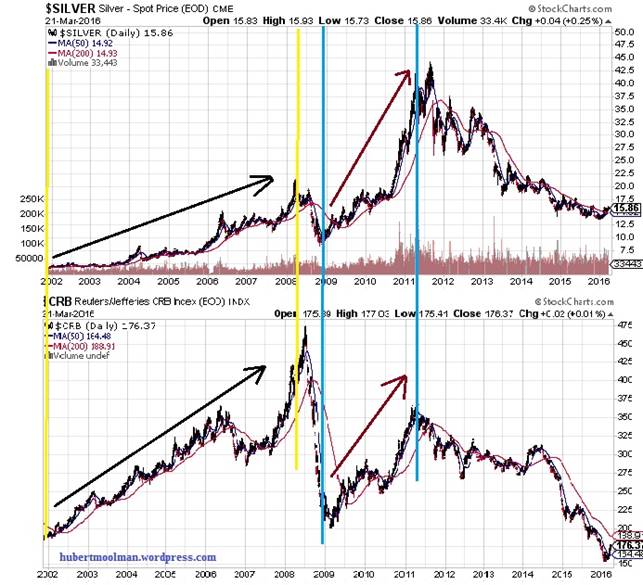
However, the bull markets of most of these competing instruments seem to have come to an end. The charts for the Dow, oil and other commodities are not looking good. The “elimination” of these investment instruments (due to their bear market) as viable competing assets will be extremely beneficial to silver (and gold).
This leg of the bull market for silver will be different to the previous leg (2001 to 2011), like cycling downhill is to cycling uphill. With silver and gold almost being the only great investment options over the coming years, we will see a massive silver and gold bubble.
Below are some long-term fractal analysis for oil and the Dow:
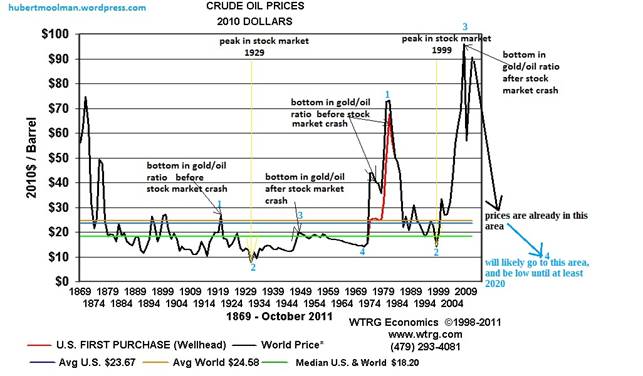
Above, is a long-term oil chart. On the chart, I have marked two fractals (1 to 4), to show how oil could trade over the coming years. Furthermore, these fractals exist in a similar context relative to economic conditions.
If the second fractal (1980 to now) completes its similarity to the first one (1919 to 1970), then oil will eventually trade below the $10 level. Although there will be bear market rallies, the trend should still be down. The bear market situation is about the same for the CRB index.
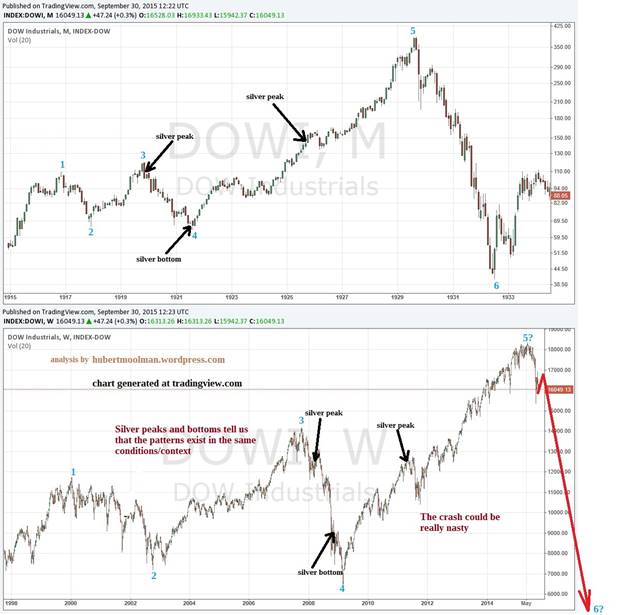
Above, is a fractal comparison between the current period (1998 to 2015) and the 1920/30s, for the Dow (charts from tradingview.com). Follow the two patterns marked 1 to 5. I have also indicated where silver peaks and bottoms occurred, to show that both patterns exist in similar conditions. This means that there is a strong likelihood that the crash will occur.
If the Dow peak is in (at point 5), then it could free fall soon, much like the October 1929 crash. This could be the greatest Dow crash ever. Again, although there will be bear market rallies, the trend will be down.
********
For more on this and this kind of fractal analysis, you are welcome to subscribe to my premium service. I have also recently completed a Silver Fractal Analysis Report as well as a Gold Fractal Analysis Report.
More from Silver Phoenix 500


