Bitcoin – Every pullback is a buying opportunity


Over the last few weeks banks have been imploding and fears of a 2008-style crisis have come into play. Of course, politicians have rushed to the rescue with huge amounts of fiat money, while the bond markets have already priced in a pivot away from restrictive monetary policies. But as global markets slowly trying to recover from the shock of this month’s US bank collapses (Silvergate Capital, Silicon Valley Bank, Signature Bank) and a government-backed rescue of Credit Suisse in Europe, Bitcoin has come out on top! It could be Bitcoin’s “watershed moment” thanks to the banking turmoil as the biggest cryptocurrency is enjoying its best quarter in 2 years amid financial turbulence. Bitcoin – Every pullback is a buying opportunity.
Review
About a month ago, we designated the 30,000 USD threshold as Bitcoin’s next price target. With a recent peak at 28,936 USD, progress has been made toward this round psychological number. However, the path taken to arrive there was rather turbulent and far from straightforward.
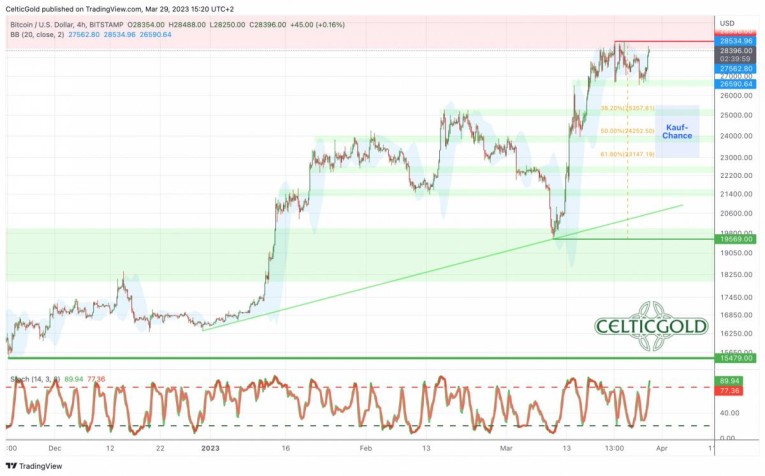
Bitcoin in USD, 4-hour chart as of March 29th, 2023. Source: Tradingview
Initially, bitcoin reached its highest level in eight months at 25,234 USD on February 16th. Following three failed attempts to surpass the 25,000 USD resistance, prices gradually retreated southward. Due to the sudden bank run in the United States, the correction intensified quickly causing Bitcoin to plummet three floors lower, with the lowest point being reached at 19,569 USD.
As the magnitude of the bailout to stabilize the banking crisis resulting from the Silicon Valley Bank’s failure became clear on the evening of Sunday, March 12th, Bitcoin quickly surged to 22,000 USD. This prompted an immediate V-shaped trend reversal in the market, resulting in a gain of nearly 10,000 USD (more than +47%) within just ten days. Finally, on March 28th, Bitcoin achieved its highest level since June 11th, 2023, at 28,936 USD.
In conclusion, Bitcoin once again underlined its volatile nature with such an erratic price behavior. Nonetheless, it also impressively reaffirmed its status as a haven in the face of unrestricted monetary expansion during a very challenging market environment, outperforming 98% of all companies in the wide-ranging S&P 500 index in March.
Technical Analysis for Bitcoin in US-Dollar
Bitcoin Weekly Chart – Strong resistance zone between 28,500 and 31,500 USD
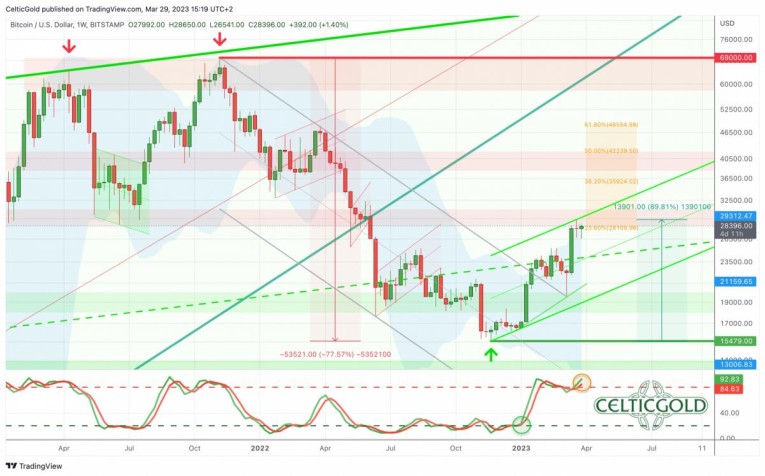
Bitcoin in USD, weekly chart as of March 29th, 2023. Source: Tradingview
Over the past four months, Bitcoin staged a remarkable rebound (+89.81%) from its low at 15,479 USD on November 21st to its recent peak at 28,936 USD. While the early weeks of the recovery in December were shrouded in uncertainty, two substantial green weekly candles in the first half of January brought greater clarity. February, however, was a period of consolidation, with prices firmly heading north again in March.
During this fulminant recovery, the 23.60% retracement (28,109 USD) was already surpassed. The 38.2% retracement (35,924 USD) is also likely to be reached, too. On the journey there, the round number of 30,000 USD within the broad resistance zone between 28,500 USD and 31,500 USD may pose challenges. Actually, it is rather improbable that this robust resistance zone will be overcome directly. Instead, Bitcoin may require several attempts before gaining the necessary momentum to move towards 35,000 USD and beyond.
Overall, and despite its overbought stochastic oscillator, the weekly chart remains bullish. The next price targets are at 30,000 USD and 35,000 USD. However, given the circumstances, a more substantial correction may be required to reach these objectives. Alternatively, if the current recovery follows the roadmap established in 2019, a direct march towards USD 50,000 by early June could be feasible.
Bitcoin Daily Chart – 200-day moving average has held
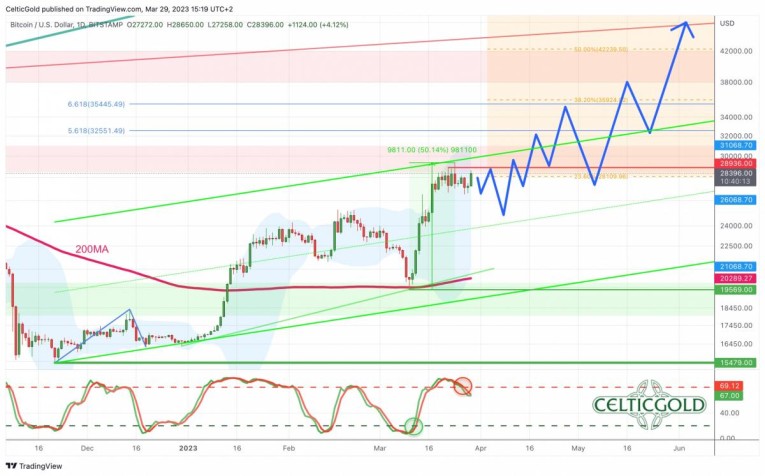
Bitcoin in USD, daily chart as of March 29th, 2023. Source: Tradingview
On its daily chart, Bitcoin had already rallied towards 25,234 USD before the emerging banking crisis forced a pullback. This pullback bottomed right at the 200-day moving average (20,253 USD) and Bitcoin prices turned sharply higher from there. Currently, this initial thrust (+50.14%) is being consolidated at elevated levels, with prices holding above the initial support at 26,500 USD.
While a minor correction below 25,000 USD could be beneficial, many have missed the substantial rise and are now eagerly waiting for a chance to buy in. As a result, “the fear of missing out” has returned to the market. Given the sharp V-shaped trend reversal, Bitcoin is therefore unlikely to do the laggards too many more favors. Thus, “the fear of not missing out” returns to the market.
In summary, the daily chart is bullish and suggests a rise to around 30,000 USD soon. On the downside, ideally, the new support around 25,000 USD should already withstand possible attacks by the bears. A pullback towards 23,000 USD would be even more of a buying opportunity. Only a drop below 20,000 USD ends our optimistic recovery scenario.
Sentiment Bitcoin – Every pullback is a buying opportunity
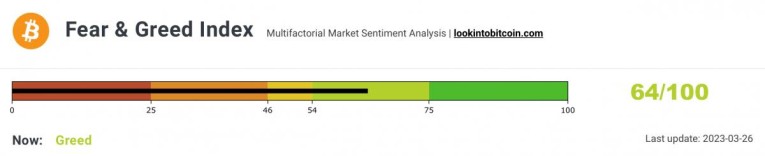
Crypto Fear & Greed Index, as of March 25th, 2023. Source: Lookintobitcoin
The sentiment in the crypto sector has continued to brighten over the past four weeks. With a score of 64 of 100, the Crypto Fear & Greed Index thereby slowly but surely approaches the overly optimistic “greed state” .
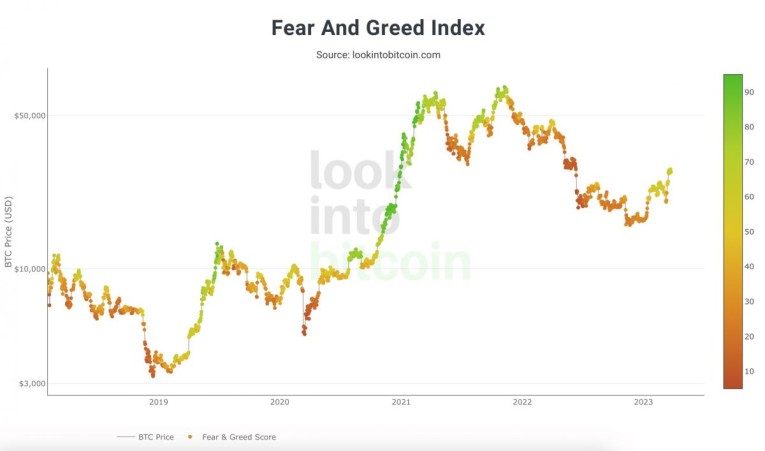
Crypto Fear & Greed Index long term, as of March 25th, 2023. Source: Lookintobitcoin
However, the sentiment index still has a lot of room for improvement. Only at levels above about 75 to 80 should the ongoing recovery get into troubles. Hence, the surprise potential continues to sit on the upside.
Overall, Bitcoin is far from euphoria and excessive optimism. At the same time, however, there is no contrarian buying opportunity either.
Seasonality Bitcoin – Still positive until early June
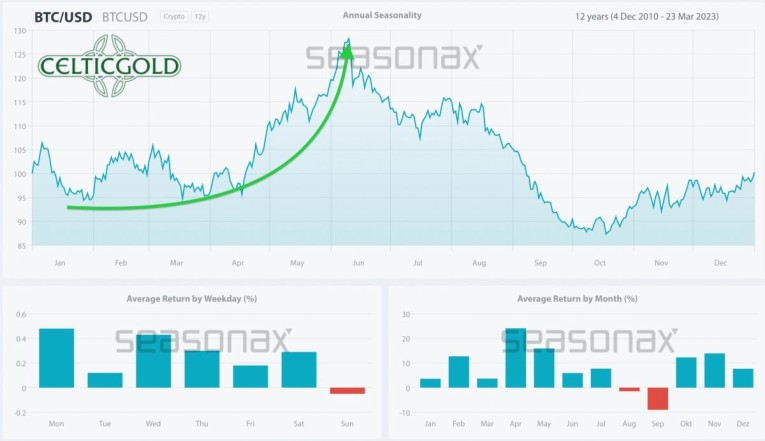
Seasonality for Bitcoin, as of March 23nd, 2023. Source: Seasonax
The seasonal pattern is conducive to the ongoing rally in Bitcoin, potentially providing support until early to mid-June. However, subsequent to this timeframe, the seasonal statistic shifts, and historically, Bitcoin experiences substantial downward pressure from mid-June through late autumn.
Sound Money: Bitcoin vs. Gold
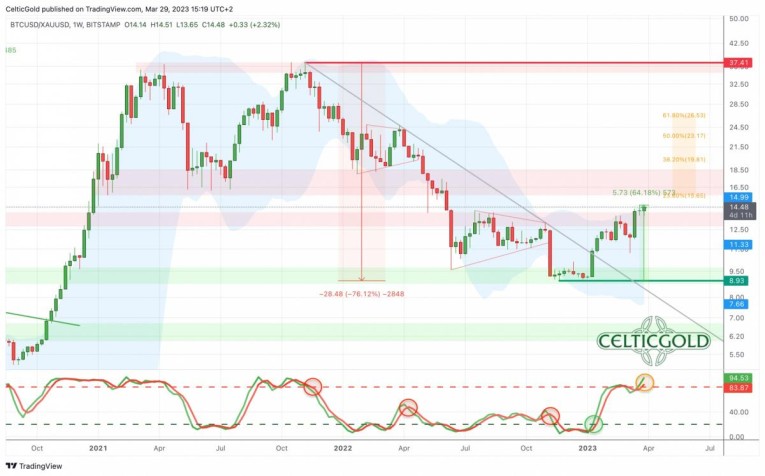
Bitcoin/Gold-Ratio, weekly chart as of March 29th, 2023. Source: Tradingview
Gold as well as Bitcoin have seen significant gains in the past two weeks. With current prices of just under 28,325 USD for one Bitcoin and 1,965 USD for one troy ounce of gold, you would have to pay around 14.4 ounces of gold for one Bitcoin. Put another way, a troy ounce of gold currently costs about 0.069 bitcoin.
Despite the sharp rise in the price of gold and the short-lived but sharp pullback in Bitcoin, since the beginning of the year, Bitcoin has clearly been the faster horse. In fact, Bitcoin has outperformed gold by up to 61.85% since January 1st. While gold’s conservative nature provides a stable anchor in a risk-off environment, such as in 2022, Bitcoin is much better suited for a risk-on mode. In a constantly changing market environment, the combination of Bitcoin and gold works best.
Bitcoin strongly outperforms gold (again)
From a technical standpoint, the Bitcoin/gold-ratio continues to favor Bitcoin’s outperformance over gold. The recovery that has been ongoing since the beginning of the year has yet to reach its minimum target (23.6% retracement) at 15.65. A “small” standard recovery should at least bring the ratio back up to the 38.2% retracement (19.81). However, the increasingly overbought weekly stochastic is sending a warning signal.
In summary, the Bitcoin/gold-ratio has been clearly in recovery since the beginning of the year. Yet, there would still be room to reach the minimum recovery target in the range of 15.50 to 16.
Macro Update – Banking crisis causes pivot in central bank policy
With the collapse of Silicon Valley Bank, the financial crisis has returned overnight and with full force. In the meantime, the New York Signature Bank and Silvergate Bank, as well as the traditional Credit Suisse, have also been wound up. More than 180 US banks are said to be in similar difficulties, as they would actually be insolvent due to unrealized losses of more than 620 billion USD caused by the Fed’s unexpected interest rate hikes over the last 12 months. Rumors about Deutsche Bank and US brokerage firm Charles Schwab are also increasing. At the same time, investors have withdrawn more than 500 billion USD from banks in a very short time and transferred it to supposedly safer havens. The biggest bank collapse since the 2008 financial crisis fuels speculation and fear of a domino effect.
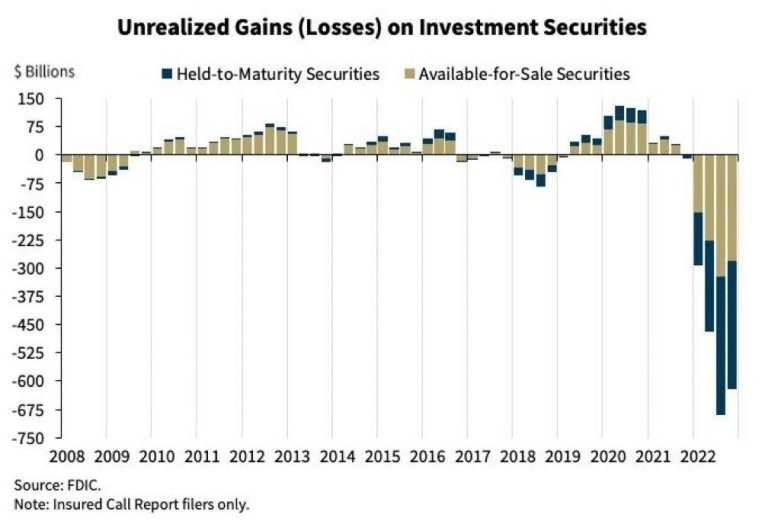
Unrealized gains (losses) from securities. Source: FDIC
Over the past 12 months, we have repeatedly warned that the US Federal Reserve’s brutal interest rate hikes would cause damage. Now, in a very short time, three US financial institutions have collapsed, and a huge catastrophe threatens the global financial system. The responsible parties are the hasty interest rate hikes, which are pushing the over-indebted banking system and therefore the entire global economy to the brink.
The end of restrictive monetary policies
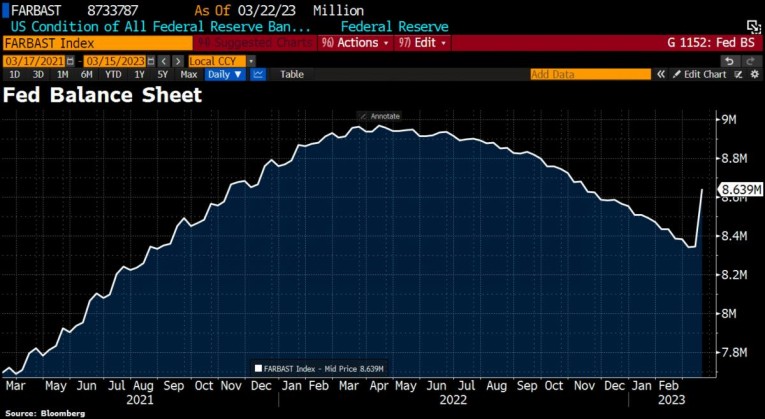
US Federal Reserve balance sheet as of March 23rd, 2023. Source: Holger Zschaepitz
Of course, governments and central bankers responded with unprecedented bailout measures, causing the Fed’s balance sheet to increase by over 300 billion USD and likely marking the end of their restrictive monetary policies. However, failure to cut interest rates may result in further harm to the banking system and the economy as a whole, potentially leading to riots, anarchy, and revolution.
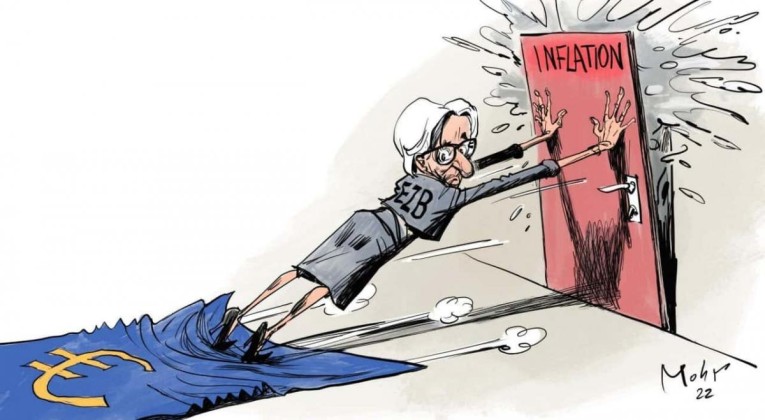
Ultimately, expect an increase in the printing of money as a short-term solution, leading to a return of loose monetary policies and high inflation rates in the coming years, possibly even sooner. The fight against inflation is lost.
Deutsche Bank credit default swaps are soaring
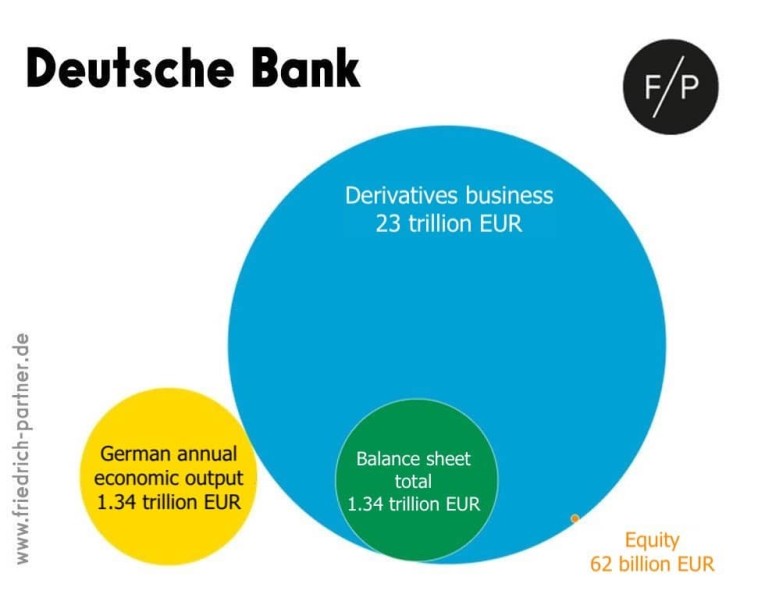
Situation at Deutsche Bank on March 25th, 2023. Marc Friedrich
In the midst of these efforts to restore investor confidence, Deutsche Bank has come under particular scrutiny due to concerns about its financial stability and potential losses. The bank’s credit default swaps (CSD), which can be used to hedge against defaults on bank bonds, have risen dramatically. This incites speculation about the possibility of its collapse and a takeover coup planned by the World Economic Forum (WEF). Generally speaking, all systemically important banks are apparently to be brought “on course” for the coming digital currencies (CBDCs), if they are not already.
Lifebelt against money printing
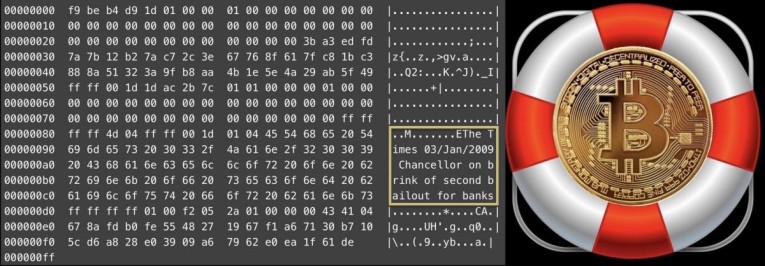
For investors, this means that precious metals, Bitcoin and cash are more important than ever. While you can probably escape expropriation in the event of bankruptcy with quality stocks (special assets), your wealth will only be outside the collapsing financial system if held in gold, silver and Bitcoin. And while bank stocks collapsed, Bitcoin rose sharply. Should galloping inflation or even hyperinflation occur, Bitcoin will be the fastest horse.
Conclusion: Bitcoin – Every pullback is a buying opportunity
In the last three weeks, events have come thick and fast. Even if the responsible central bankers and politicians are still squirming, the “interest rate hike and balance sheet reduction” experiment has clearly failed. One can only hope that things will calm down a bit in the short term and that this will buy investors some time. In any case, the uncertainty is huge, and the implosion could now also unfold very quickly. Alternatively, and much more likely though, inflation will accelerate dramatically.
Ideally, Bitcoin will provide another buying opportunity with a short-term pullback into the range between 23,000 USD and 25,000 USD. That would be another chance to transfer wealth into the digital gold called Bitcoin and thus bring your hard-earned fiat money to safety.
In any case, our recovery scenario outlined in December remains intact. In view of the dramatic situation in the financial system, we would not be surprised if Bitcoin were to scratch the 50,000 USD mark in just a few months.
*********
More from Silver Phoenix 500


