Bitcoin - Correction Still Not Over!


Bitcoin has been consolidating for more than two and a half months now. Generally, the set-up is still bullish while the overbought situation has been neutralized. A move out of the triangle is coming closer. Even though lower prices might be coming first the usually strong fourth quarter should bring much higher bitcoin prices rather soon. Bitcoin - Correction Still Not Over. But it´s time to buy a small starter position and arrange enough cash at the sidelines to buy any larger dip!
Review
Since peaking at US$13,887 on June 26th, 2019, Bitcoin (has been moving sideways in the range of US$9,200 to US$12,000 in the last two and a half months. In my analysis from July 14th, 2019 as well as in my analysis from August 15th, 2019, I had warned of the summer doldrums and a continuation of the grueling sideways phase including lower prices. However, the July 28th low at just under US$9,100 has not yet been undercut. Therefore, the open gap in the Bitcoin Futures at US$8,500 has therefore not yet been closed. At the same time though, the sideways movement has completely neutralized the overbought situation in which Bitcoin was in late June. In this respect, the correction so far took place primarily over the time axis (more than 10 weeks) and less via the price (-34%)!
Technical Analysis For Bitcoin
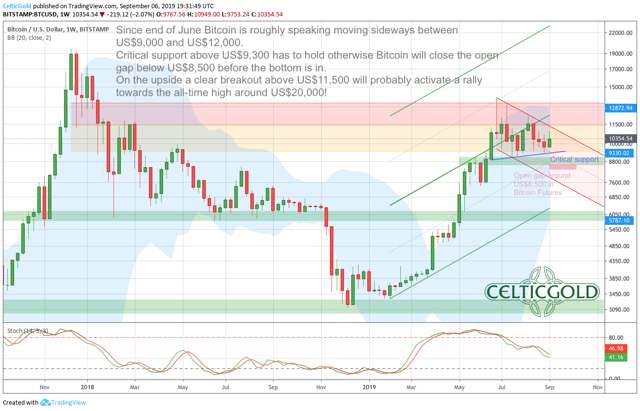
Bitcoin in US-Dollar, weekly chart as of September 6th,2019. Source: Tradingview
On the weekly chart, the overall extremely bullish setup remains obvious. Bitcoin has risen from US$0.008 to nearly US$20,000 in just under 10 years, far outperforming all other asset classes. It is very likely that this unique performance will continue in the coming years.
As well, the consolidation of the past twelve weeks underscores the potentially bullish continuation setup, because the previous low at US$9,100 was so far all the bears were able to achieve. Any investor who wanted to get into Bitcoin at really low prices using a contrarian approach (buying into panic) has been waiting in vain so far!
But despite the stable consolidation at high levels, the correction might not yet be completed. The triangle, which has developed since late June, can lead to a move in both directions of course. But the lower side of the triangle is nearly horizontal while the series of lower highs is very evident. Therefore, the triangle could be also interpreted as an descending and therefore bearish triangle. A breakdown could lead to a pullback to around US$7,000. And although the Stochastic Oscillator now moves clearly in neutral territory, the open gap in Bitcoin Futures at US$8,500 has not (yet) been closed.
And even if we are just a few weeks away from the next big move up, the "Bitcoin tree" might be shaken one more time to throw off the last weak hands. We know this game well enough from all other markets. Therefore, it is still possible that the correction is not yet over and a final buying opportunity between US$7,500 to US$8,600 over the next four weeks might emerge.
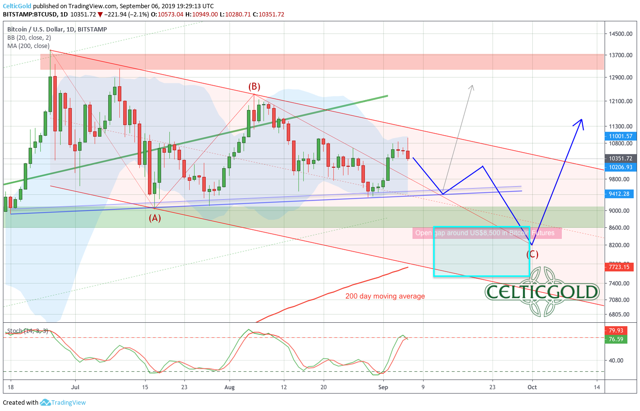
Bitcoin in US-Dollar, daily chart as of September 6th, 2019. Source: Tradingview
The daily chart shows the series of lower highs. At the same time, a crucial support zone has now emerged on the bottom, ranging from US$9,300 to US$9,100. The combination of the lower highs and the more or less horizontal support results in a rather descending and therefore bearish triangle.
In connection with the still open gap at US$8,500 in the Bitcoin Future as well as the still relatively large gap to the rising 200-day moving average (US$7,772), the suspicion that Bitcoin might dive again in the next few weeks remains. The traditionally weak month of September could cause the final sell-towards US$8,500 and lower.
If, on the other hand, Bitcoin can climb above US$11,500 US-Dollars the picture brightens up significantly. In this case, the start of the rally towards the all-time high at US$20,000 might already lie behind us. But since the stochastic oscillator on the daily chart has just turned down from its over-bought zone, this positive scenario seems rather unlikely.
At the start of this weekend, the bears managed to push prices lower. On the daily chart the warning (sell) signals outweigh any bullish perception. We recommend a wait-and-see attitude.
Commitments of Traders Report For Bitcoin
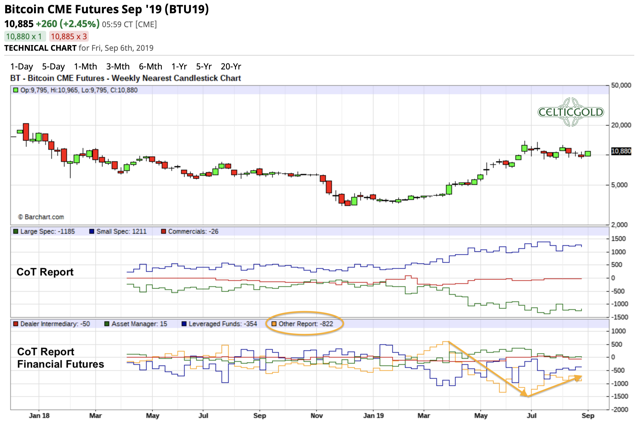
Commitment of Traders for Bitcoin as of August 27th, 2019 Source: Barchart
The CoT report for the Bitcoin Future has gradually improved in recent months, but there is certainly not (yet) a countercyclical bottleneck. Especially as the "Other Reportables" continue to hold a rather large short position.
Among the "Other Reportables" the U.S. Commodity Futures Trading Commission (CFTC) puts together all reportable traders who cannot be attributed to any of the three groups of producers, swap dealers or money managers together. From a contrarian point of view and in retrospect, this group has played the bitcoin rally almost perfectly this year, because at the start of the Rally in April they were heavily positioned on the long side. Until mid-June, the "Other Reportables" then moved further and further to the short side. Since the high, they have gradually covered their shorts into the falling prices again. Apparently, the current price levels between US$10,000 and US$11,000 do not seem to be low enough for this group to move back to cover more of their shorts.
Therefore, if you want to follow the group of the "Other Reportables", Bitcoin has further correction need and would have to reach a new low in the coming weeks or until the autumn.
Sentiment Bitcoin
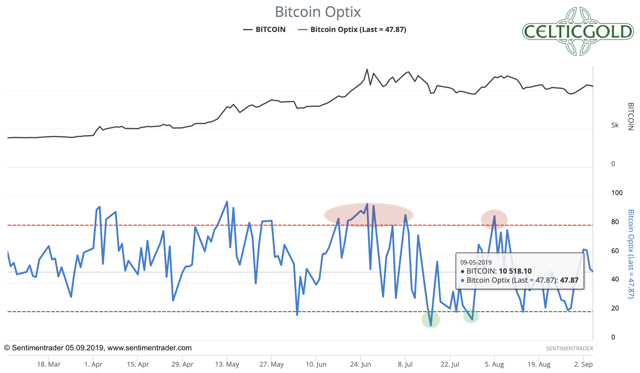
Bitcoin Optix as of September 5th, 2019. Source: Sentimentrader
Based on data from sentimentrader, bitcoin currently has a neutral mood. Neither can one notice an exaggerated optimism nor a panic fear among the market participants.
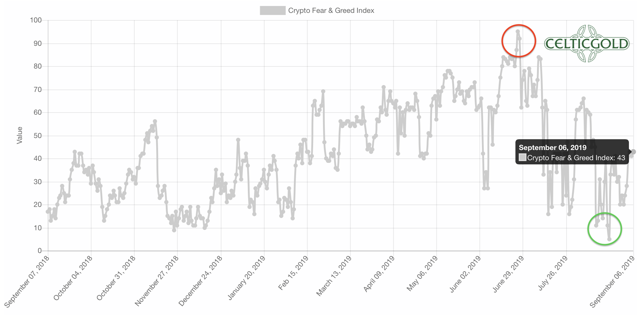
Source: Crypto Fear & Greed Index
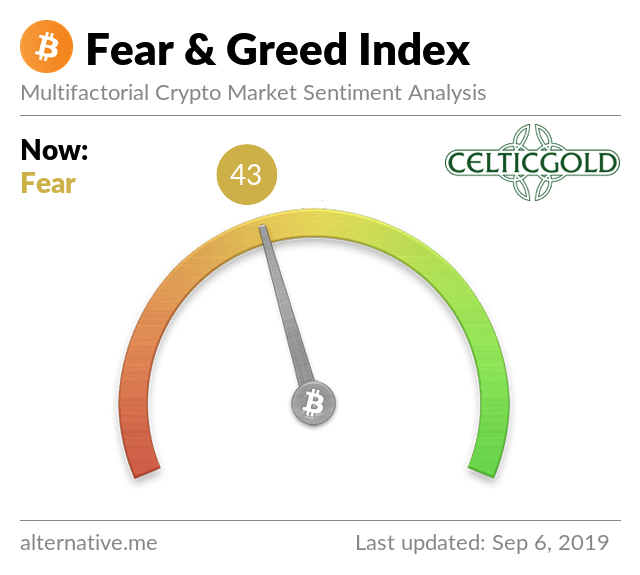
Source: Crypto Fear & Greed Index
The even more complex "Fear & Greed Index" comes to more or less similar results, whereby the fear outweighs minimal.
Overall, the sentiment analysis currently does not provide any clear results from a contrarian point of view. But this neutral setup is typical after months of sideways movement of course.
Seasonality Bitcoin
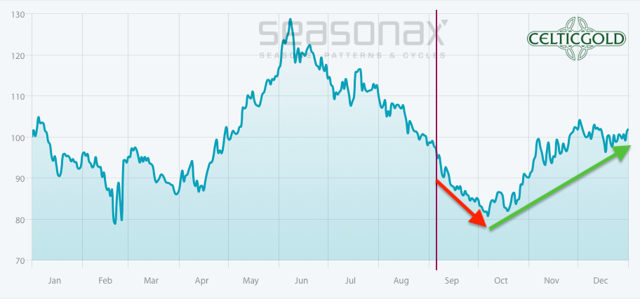
Seasonality for Bitcoin as of September 6th, 2019. Source: Seasonax
Based on the evaluation of the first 10 years of its existence, Bitcoin has developed a fairly clear seasonal pattern. Accordingly, we are currently in the last spurs of the typically weak summer months. In the first two weeks of October, the statistically strong fourth quarter begins for the Bitcoin. Of course, one should not overvalue the seasonality or bet on the exact cycle pedantically, but the increased probability of a new upward movement from the beginning / middle of October is undeniable.
In summary, the seasonality recommends a few more weeks of patience. Any larger pullback in the next days and weeks might be already a buying opportunity in anticipation of a strong fourth quarter.
Bitcoin against gold
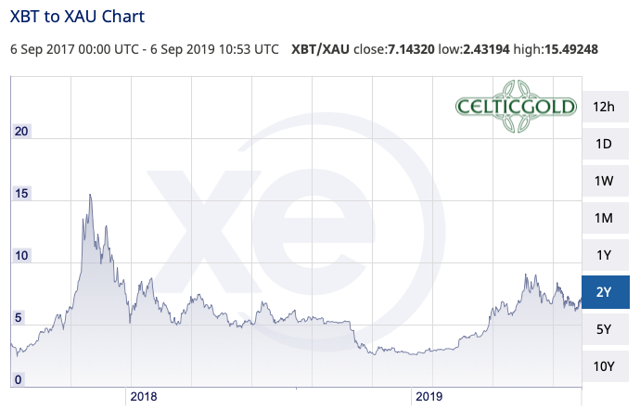
Bitcoin in Gold as of September 6th, 2019. Source: XE
Currently, a bitcoin costs just under 7.14 ounces of gold. In other words, one ounce of gold currently costs 0.14 Bitcoin! Gold has become slightly more expensive against Bitcoin in the last four weeks. Since gold is currently heavily overbought and may just be at the start of a larger correction, swap from bitcoin into gold is no longer compelling. If Bitcoin however takes one more deep breath, under trading aspects it could be interesting to exchange gold back into Bitcoin.
Basically, one should be invested in both asset classes. The recommended allocation in precious metals (primarily physical) should be at least 10% and a maximum of 25% of one’s total assets. In cryptos and especially in Bitcoin investors should hold at least 1% and a maximum of 5%. If you are very familiar with crypto currencies and Bitcoin, you can individually allocate higher percentages in Bitcoin. For the normal investor, who of course is invested mainly in equities and real estate, holding 5% in the highly speculative and highly volatile Bitcoin is already quite a lot!
Conclusion And Recommendation
As forecasted, it was a rather difficult summer for Bitcoin and especially for Bitcoin traders, because sideways markets without clear trend direction are extremely difficult to trade. However, after the impressive rally in spring, it was obvious that such a highly directional phase would again have to be followed by a difficult and confusing trading phase. This is exactly what Bitcoin has delivered since the end of June.
However, in view of the seasonality, the traditionally bullish fourth quarter is getting closer and closer. Nevertheless, I still expect lower prices first in the coming weeks. The closure of the open gap in Bitcoin Futures at US$8,500 is an option too. After that, however, significantly higher prices are actually extremely likely again until the end of the year.
If the bitcoin indeed falls back into the range between US$7,500 and US$8,600, I recommend an aggressive entry. But as I don't have a crystal ball it also makes sense to buy a starter position at current levels too as Bitcoin could also begin its breakout to the upside rather soon. In the big picture, significantly higher prices are conceivable in the coming years.
*********
More from Silver Phoenix 500


