Can Silver Lead PMs Higher Still?


It’s not true that yesterday’s session in precious metals was uneventful. While gold and mining stocks didn’t do much, silver moved a bit above its previous high, closing at a fresh 2019 high. Sounds pretty remarkable, doesn’t it? In today’s analysis, we’ll put silver’s breakout into proper perspective and examine if the white metal has much more room to run.
Let’s dive in to the silver chart. The situation there seems to have changed - but is it really the case?
There is actually much more to the silver story than just a breakout above the recent highs. In fact, the breakout itself is not that important. What is important, is the resistance that was just reached and how it relates to what we saw in the past.
By “resistance” we actually mean two resistance levels. One is created based on the line that’s parallel to the rising support line created by connecting the 2018 and 2019 bottoms. Copying this line and moving it higher so that it touches the early 2019 high creates the upper border of the rising trend channel. This is silver’s second move higher and the “C” part of a rising ABC correction pattern (the late-2018 – early-2019 rally was the “A” part of the move and the subsequent decline was “B”). The ABC corrections (a.k.a. zigzags) are relatively common corrective patterns that don’t change the preceding trend. In this case, the trend was down.
We can speak of the big downtrend that started in 2011, or we can speak of the more medium-term downtrend that started in 2016 – either way, the corrective ABC pattern seems to have already run its course as silver moved to the upper border of the trend channel.
There is also additional reason for silver to turn south from the current price levels that’s even more important. Taking the 2016 top as the starting price for the decline and using the 2018 bottom as the final (so far) bottom, we get $16.70 as the 38.2% Fibonacci retracement. This is a good reason on its own for silver to turn around, especially if we also consider the fact that silver moved to the above-mentioned upper border of the trade channel.
The extremely bearish outlook comes from something else, though. There are many things that emphasize that the outlook is extremely bearish (such as the recent volume readings in silver and silver stocks), but with regard to the price level that was reached yesterday, there is one more very important detail that most investors will likely miss.
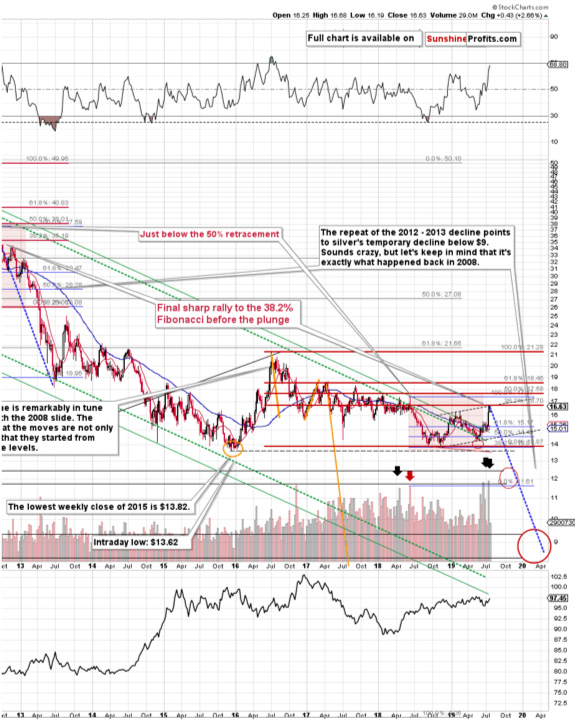
The entire 2016 – now situation and the 2011 – late-2012 price movement are very similar.
In both cases there were actually four bottoms at very similar price levels that preceded the final upswing and the first one of them was very sharp (late 2011 and mid-2017). The timing between the following bottoms was different, but there are two major similarities that just can’t be ignored or left unmentioned.
The first thing is that all major tops were lower than the previous ones. The only outlier is the early-2019 top, which – as it turned out – wasn’t the final top for the rally, so overall it seems that the analogy remains intact.
The second thing is that the top (the one in early 2012) that preceded the final top of the consolidation is extremely similar to the mid-2018 one and this an extremely useful roadmap sign that tells us where silver is in light of the entire analogy.
The key thing is that the final pre-slide (late-2012) top formed at the 38.2% Fibonacci retracement level based on the preceding decline. The early 2012 top formed slightly below the 50% retracement (intraday high) and the weekly close was a bit below the 38.2% retracement. The mid-2018 top (analogous to the late-2012 one) also formed a bit below the 50% retracement and the weekly close of that top was a bit below the 38.2% retracement.
This means that if the analogy remains intact, silver should top at the 38.2% retracement right now, which is at $16.70. And what was silver’s high yesterday? $16.68 – almost exactly the level of the retracement. This price level is today’s pre-market high based on finance.yahoo.com and stooq.com prices.
The top that was just reached is likely much more important than it seems based on just today’s intraday chart.
Summary
Summing up, these are not pleasant times for anyone who refuses to jump on the bullish bandwagon just because prices are moving higher, but what’s profitable is rarely the thing that feels good initially. The relative strength in the silver market is a factor that’s beyond bearish, while the strength in gold stocks appears just as misleading as their weakness was back in early 2016. Gold has just invalidated its breakout above the previous highs, the late-2013 highs, and the upper border of the pennant pattern, which is a very strong bearish sign. The price levels that were just reached in silver imply that the top is in.
Today's article is a small sample of what our subscribers enjoy on a daily basis. For instance today, we have shared the short-term assessment of what happened yesterday across the precious metals board. Check more of our free articles on our website, including this one – just drop by and have a look. We encourage you to sign up for our daily newsletter, too - it's free and if you don't like it, you can unsubscribe with just 2 clicks. You'll also get 7 days of free access to our premium daily Gold & Silver Trading Alerts to get a taste of all our care. On top, you’ll also get 7 days of instant email notifications the moment a new Signal is posted, bringing our Day Trading Signals at your fingertips. Sign up for the free newsletter today!.
Przemyslaw Radomski, CFA
Editor-in-chief, Gold & Silver Fund Manager
Sunshine Profits - Effective Investments through Diligence and Care
* * * * *
All essays, research and information found above represent analyses and opinions of Przemyslaw Radomski, CFA and Sunshine Profits' associates only. As such, it may prove wrong and be a subject to change without notice. Opinions and analyses were based on data available to authors of respective essays at the time of writing. Although the information provided above is based on careful research and sources that are believed to be accurate, Przemyslaw Radomski, CFA and his associates do not guarantee the accuracy or thoroughness of the data or information reported. The opinions published above are neither an offer nor a recommendation to purchase or sell any securities. Mr. Radomski is not a Registered Securities Advisor. By reading Przemyslaw Radomski's, CFA reports you fully agree that he will not be held responsible or liable for any decisions you make regarding any information provided in these reports. Investing, trading and speculation in any financial markets may involve high risk of loss. Przemyslaw Radomski, CFA, Sunshine Profits' employees and affiliates as well as members of their families may have a short or long position in any securities, including those mentioned in any of the reports or essays, and may make additional purchases and/or sales of those securities without notice.
********
 Przemyslaw Radomski, CFA, is the founder, owner and the main editor of SunshineProfits.com.
More from Silver Phoenix 500


