COMEX: Silver Registered Ratio Falls to 11.1% – Lowest in 22 Years


The drainage of silver from Comex vaults since the start of the year has been nothing short of spectacular.
This analysis focuses on gold and silver within the Comex/CME futures exchange. See the article What is the Comex? for more detail. The charts and tables below specifically analyze the physical stock/inventory data at the Comex to show the physical movement of metal into and out of Comex vaults.
Registered = Warrant assigned and can be used for Comex delivery, Eligible = No warrant attached – owner has not made it available for delivery.
Current Trends
Gold
Gold is seeing its first increase in Registered inventory since April. That said, over December, there has been a mild net decrease in metal in Comex vaults of 100k ounces.
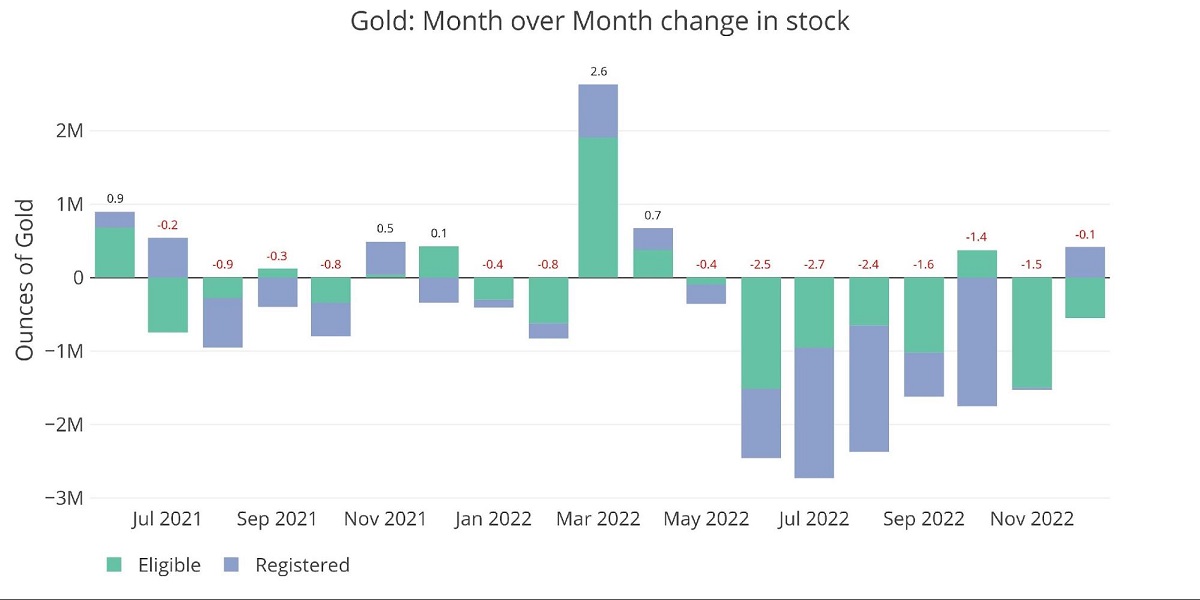
Figure: 1 Recent Monthly Stock Change
According to Comex reports, there are over 11M ounces of Gold in the Registered category. If so much metal is readily available for delivery, why are market participants moving metal from Eligible to Registered?
The short answer: there are not 11M ounces standing ready for delivery. Most of it is listed there for optics which was put in place shortly after the stress in the Comex system that occurred back in March 2020 (see Figure 8).
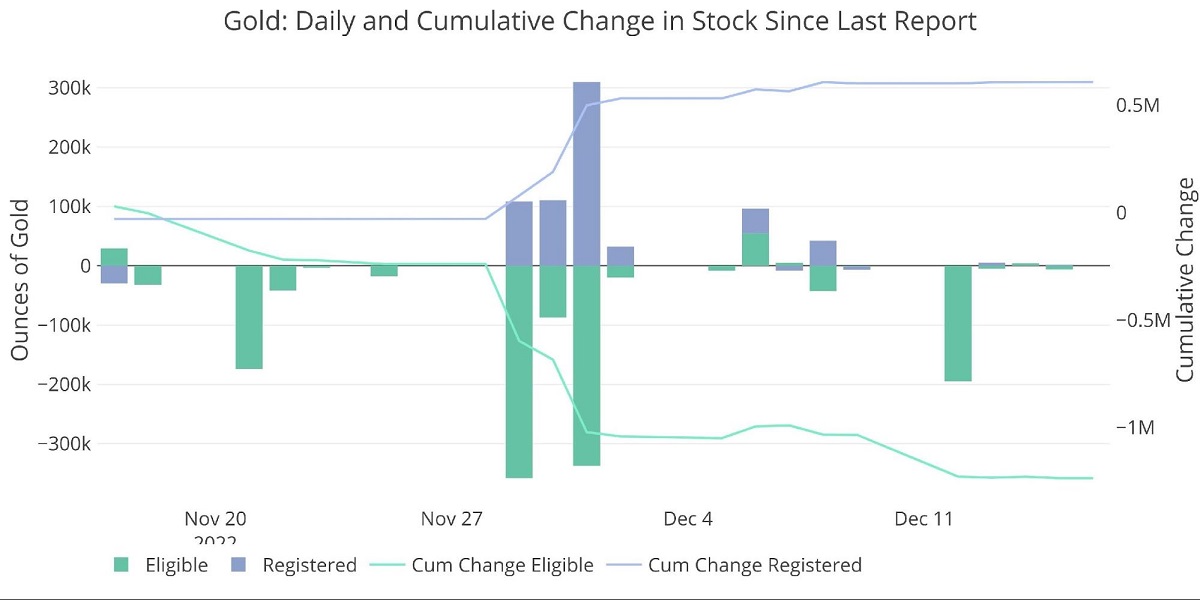
Figure: 2 Recent Monthly Stock Change
Since the start of the December contract, the amount Pledged has been steadily increasing again. Pledged is a subset of Registered but is actually not available for delivery because it has been pledged as collateral. This essentially inflates Registered by the amount shown below. Another tool to make the Registered category look bigger than it is.
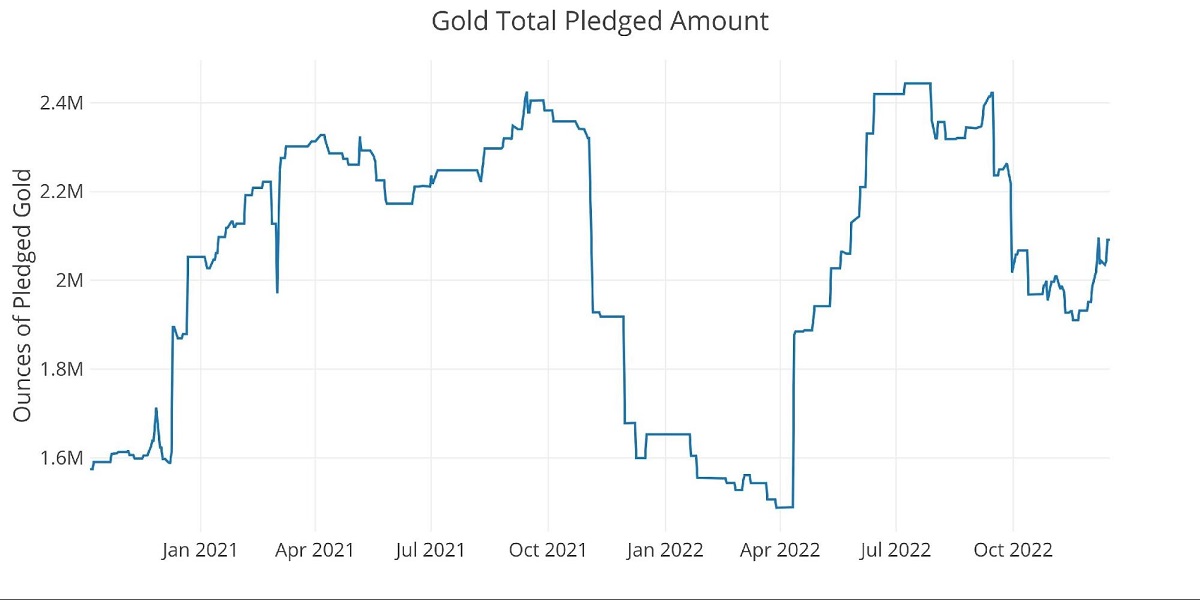
Figure: 3 Gold Pledged Holdings
Silver
The supply of silver has been shrinking even more rapidly than gold. The drainage since the start of the year has been nothing short of spectacular. 48.5M ounces have left Registered since Jan 1. That represents more than 50% of the balance of 82M ounces last Dec 31.
After all this stress on the system, the Comex was only able to add a net 300k ounces of metal so far this month.
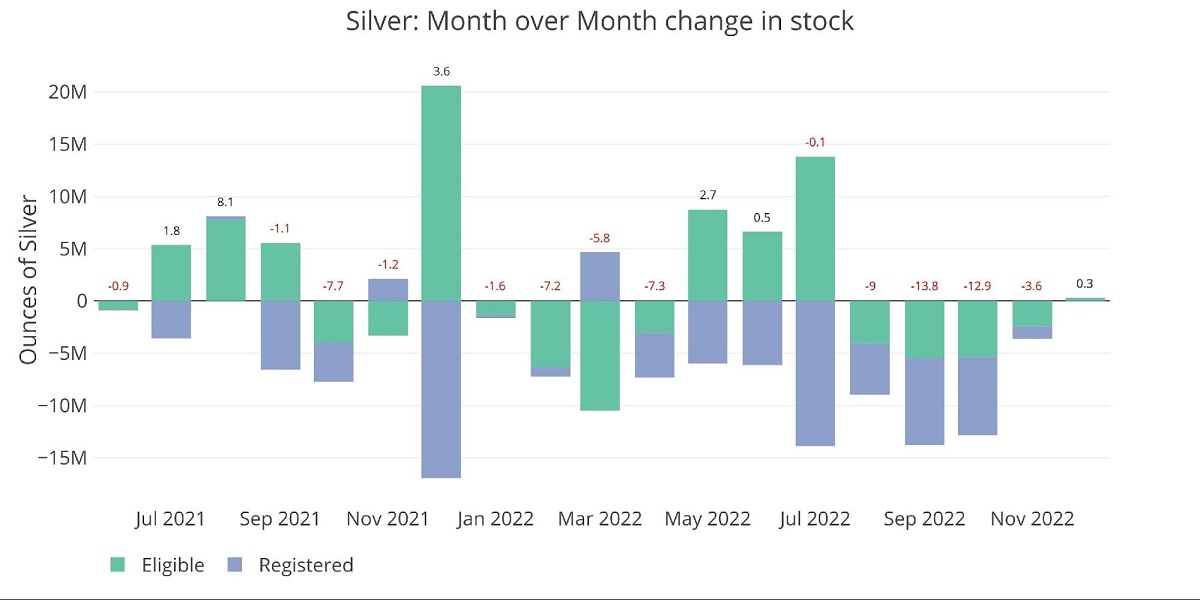
Figure: 4 Recent Monthly Stock Change
Much of the inflow came at the beginning of the month and has already been leaving since. It’s very likely that by the end of December, the net change in inventory is actually negative.
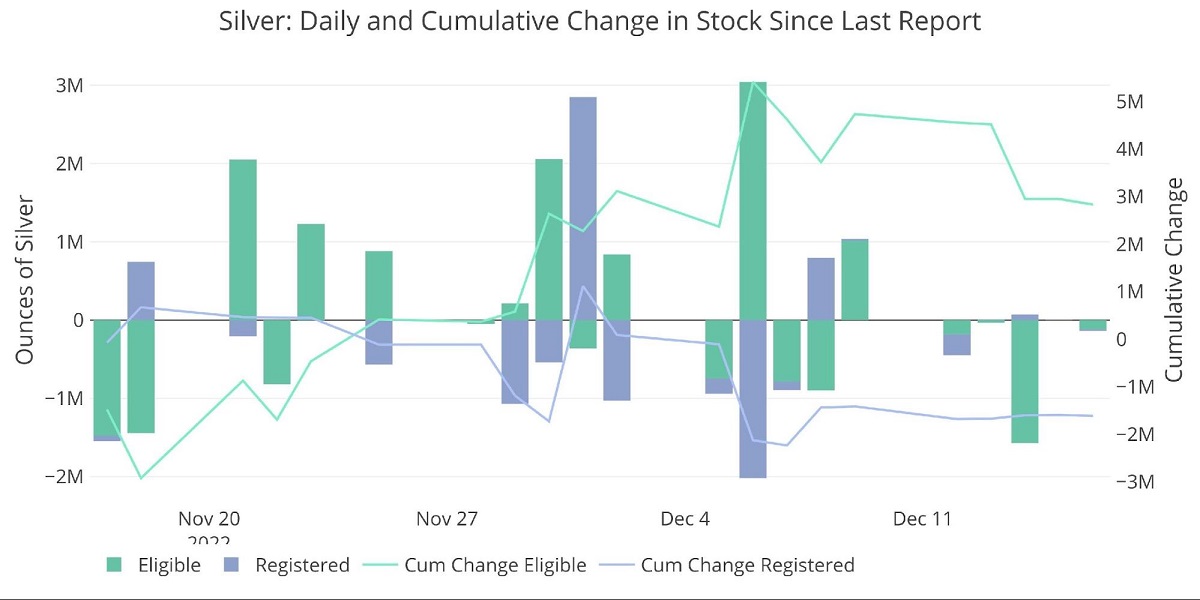
Figure: 5 Recent Monthly Stock Change
There is another major indication that shows inventory might be much smaller than is reported. As of yesterday, only 77.6% of contracts standing for delivery have actually had their metal delivered. Shorts are on the hook for deciding when to deliver the metal, so why are they dragging their feet? Through the 16th, this is the least amount of metal delivered as a percent of Open Interest on First Notice back to at least Jan 2020.
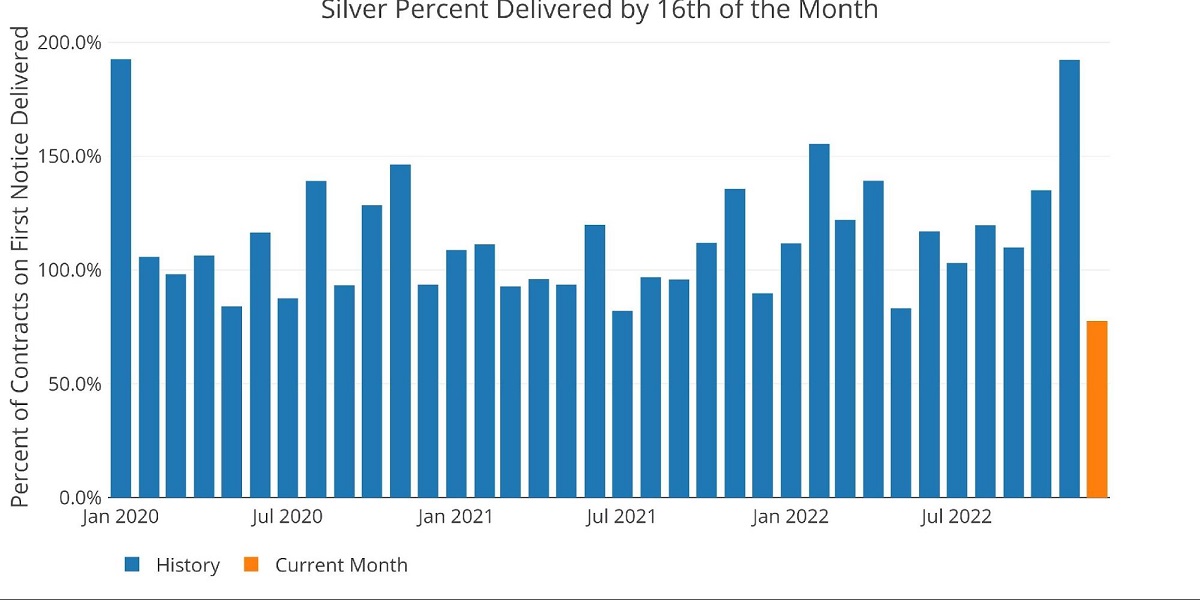
Figure: 6 Delivery Volume After First Notice
Another odd data point is the number of net new contracts after first position. There have been some months, like last July, where net new contracts are negative throughout the month. However, while this month is still positive, it went up and then reversed back down. This means that there are cash settlements happening way late in the contract.
Again, why? This does not usually happen!

Figure: 7 Cumulative Net New Contracts
Let’s look back at the vaults. The table below summarizes the movement activity over several periods to better demonstrate the magnitude of the current move.
Gold
- Over the last month, gold has seen a net inventory decrease of 2.6%
- This is being driven by 1.2M ounces leaving Eligible vs only 608k ounces being added to Registered
- Since last year, the total amount removed exceeds 10M ounces of gold
Silver
- Silver continues to see Registered supplies fall, with 1.6M ounces being removed over the last 30 days
- Eligible took a beating in the latest week, dropping almost 2M ounces
Palladium/Platinum
Palladium and platinum are much smaller markets but that may be where the market breaks first.
- Palladium saw a light increase as the delivery month got started
- Platinum inventory is down 12.1% over the last month as it prepares for the January delivery month
- It will not take many contracts standing for delivery to fully deplete Platinum from the vaults
- Platinum inventory is down 12.1% over the last month as it prepares for the January delivery month
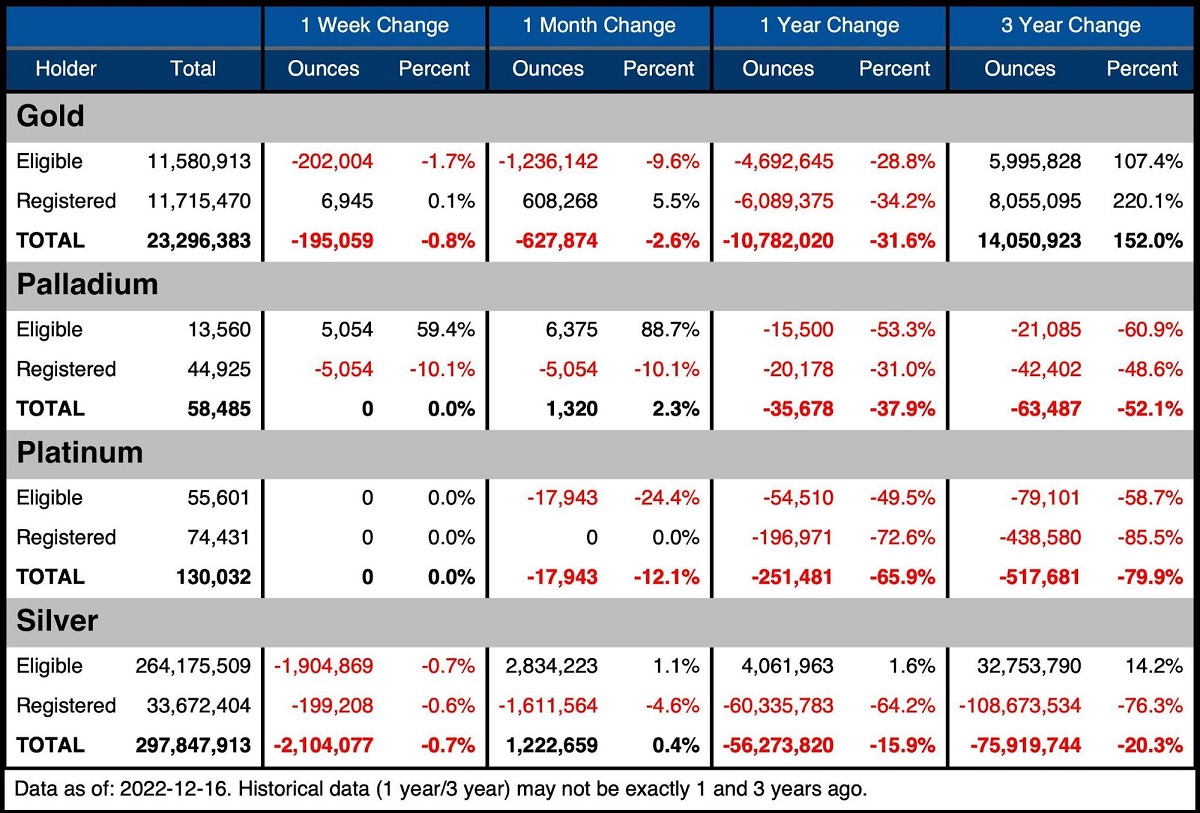
Figure: 8 Stock Change Summary
The next table shows the activity by bank/Holder. It details the numbers above to see the movement specific to vaults.
Gold
- The last month has seen net inventories fall across all vaults aside from a negligible increase in Manfra
- Brinks saw supplies fall by 7%
Silver
- Silver has seen some big moves over the last month:
- Manfra increased supplies by 4M ounces or 40%
- Delaware also saw supplies increase 2M ounces or 5%
- JP Morgan was on the other side, losing 3.8M ounces
- INT Delaware saw 264k ounces disappear which was 21%
- Manfra increased supplies by 4M ounces or 40%
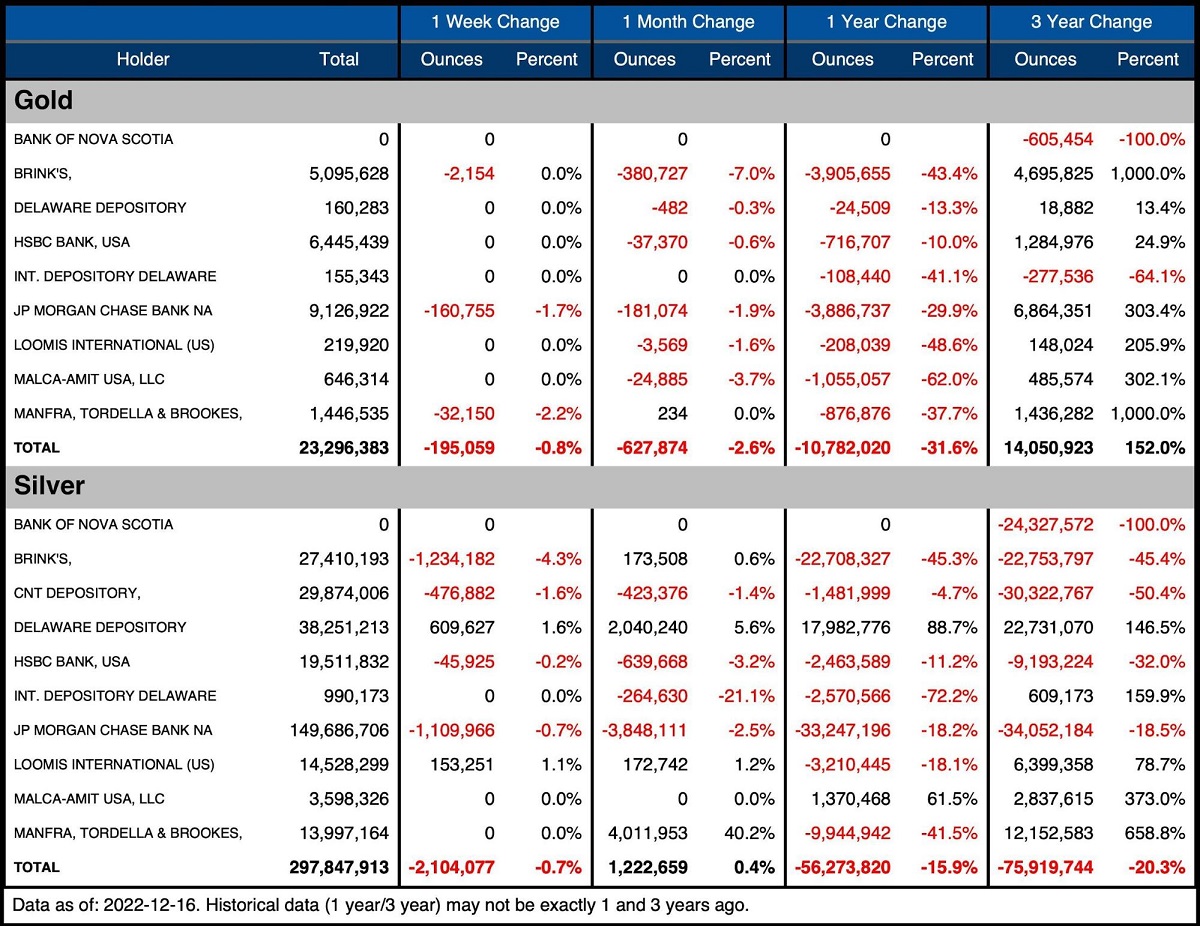
Figure: 9 Stock Change Detail
Historical Perspective
Zooming out and looking at the inventory for gold and silver shows just how massive the current move has been. The black line shows Registered as a percent of the total. As gold December delivery has started, you can see that Registered quickly moved from 45% to 50% of the total inventory.
As noted above, vault totals are still falling. This move into Registered is coming at the expense of Eligible. If there is still such a massive supply of Registered, why are banks scrambling to add metal back from Eligible?
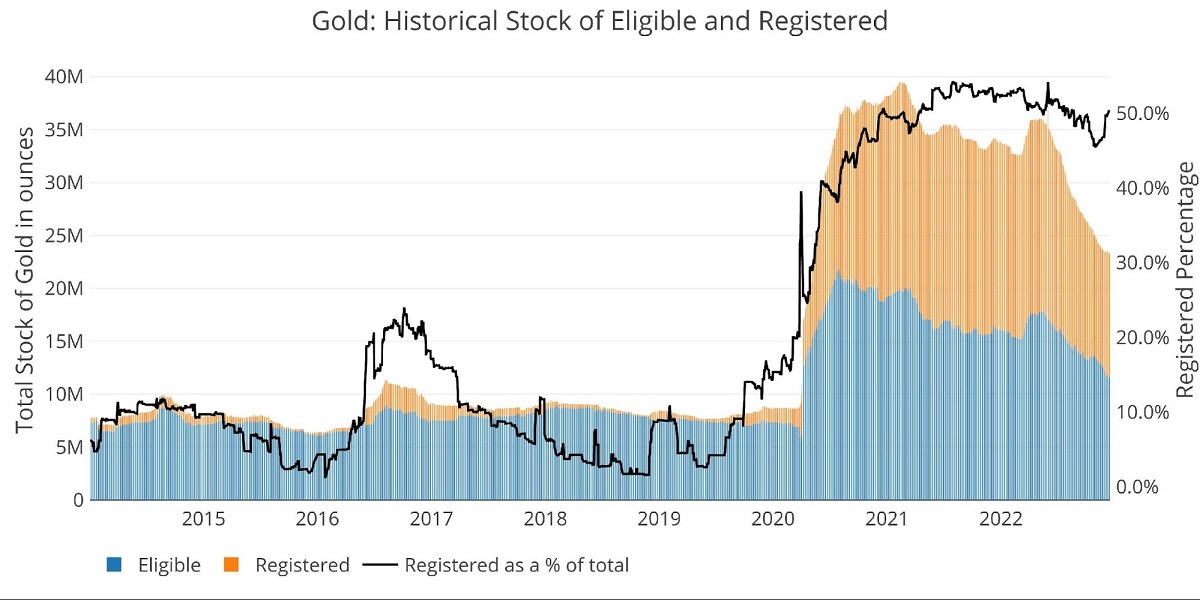
Figure: 10 Historical Eligible and Registered
Despite silver seeing a net increase in inventory over the month, Registered continues to fall. The silver Registered Ratio reached as low as 11.1% of total inventory on December 7th. This is the lowest the ratio has been since at least January 2000!! The old low was 14.7% back in December 2016. The full history really demonstrates the magnitude of the current move.
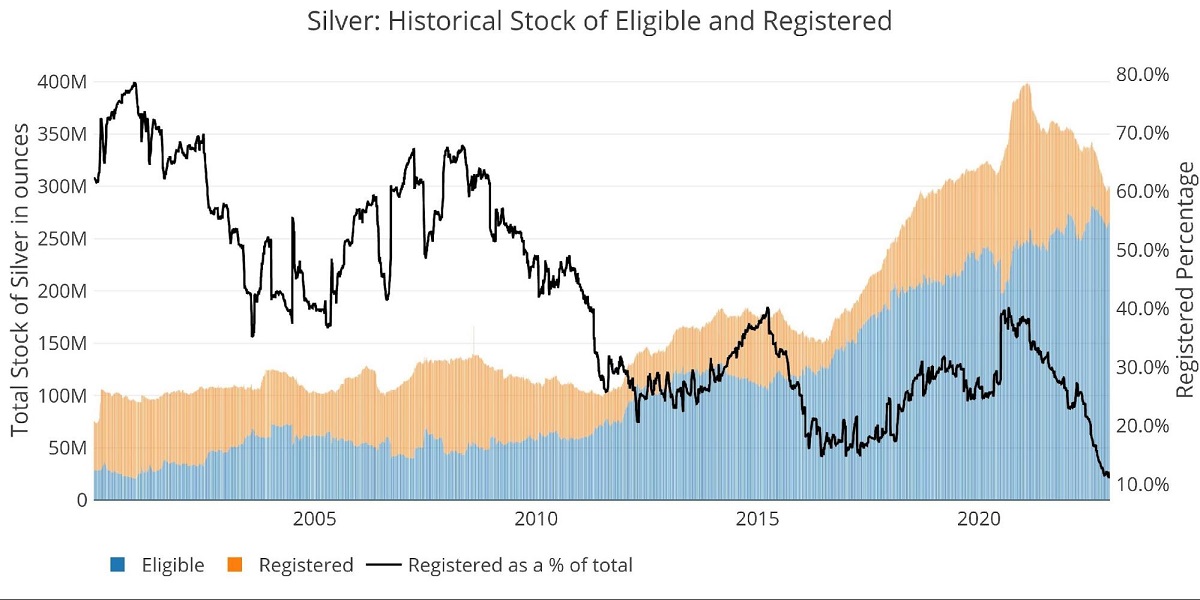
Figure: 11 Historical Eligible and Registered
The chart below focuses just on Registered to show the steepness of the current fall. In Feb 2021, Registered surged to as high as 152M ounces. That number now sits around 33M, which is a net fall of 119M ounces (78%).
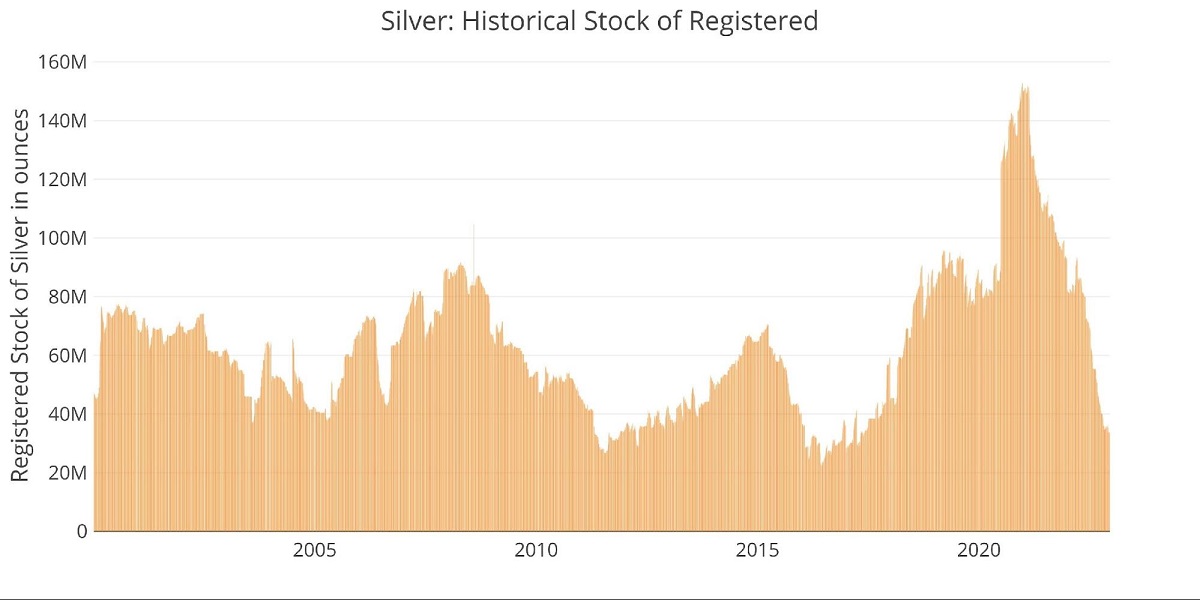
Figure: 12 Historical Registered
Comex is not the only vault seeing big moves out of silver. Below shows the LBMA holdings of silver. It should be noted that much of the holdings shown below are allocated to ETFs. Regardless, total inventories have fallen every single month since last November. Holdings fell below 1B ounces in June and now sit at 840M ounces as of November.
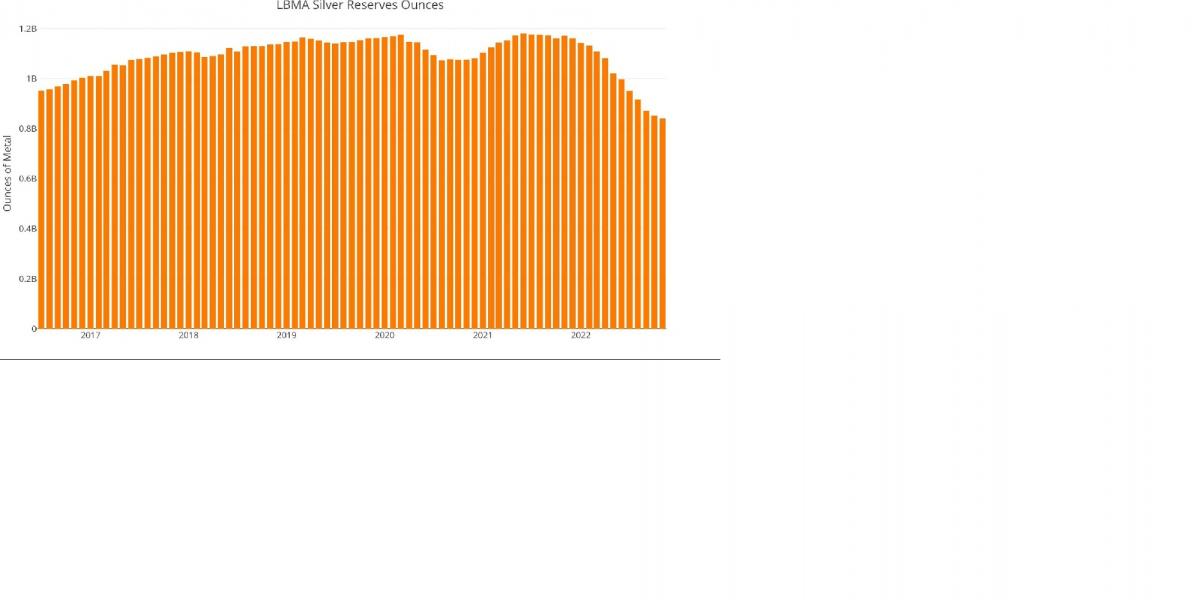
Figure: 13 LBMA Holdings of Silver
Available supply for potential demand
These falls in inventory have had a major impact on the coverage of Comex against the paper contracts held. There are now 3.6 paper contracts for each ounce of Registered gold within the Comex vaults. This is down from the recent high of 4.5 seen in November.
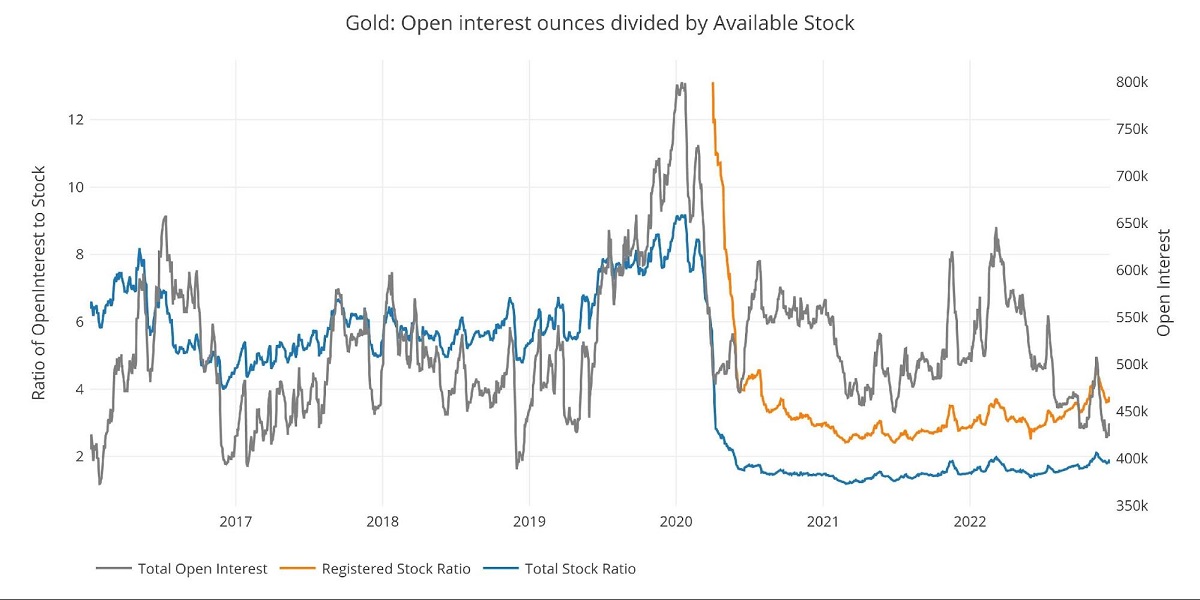
Figure: 14 Open Interest/Stock Ratio
Coverage in silver is far worse than in gold with nearly 18.3 paper contracts for each ounce of Registered silver. This is down slightly from the recent high when coverage was as thin as 20.4 paper contracts for each physical ounce in mid-November. This means a bit more than 5% of silver open interest would need to stand for delivery to wipe out Comex vaults entirely of Registered.
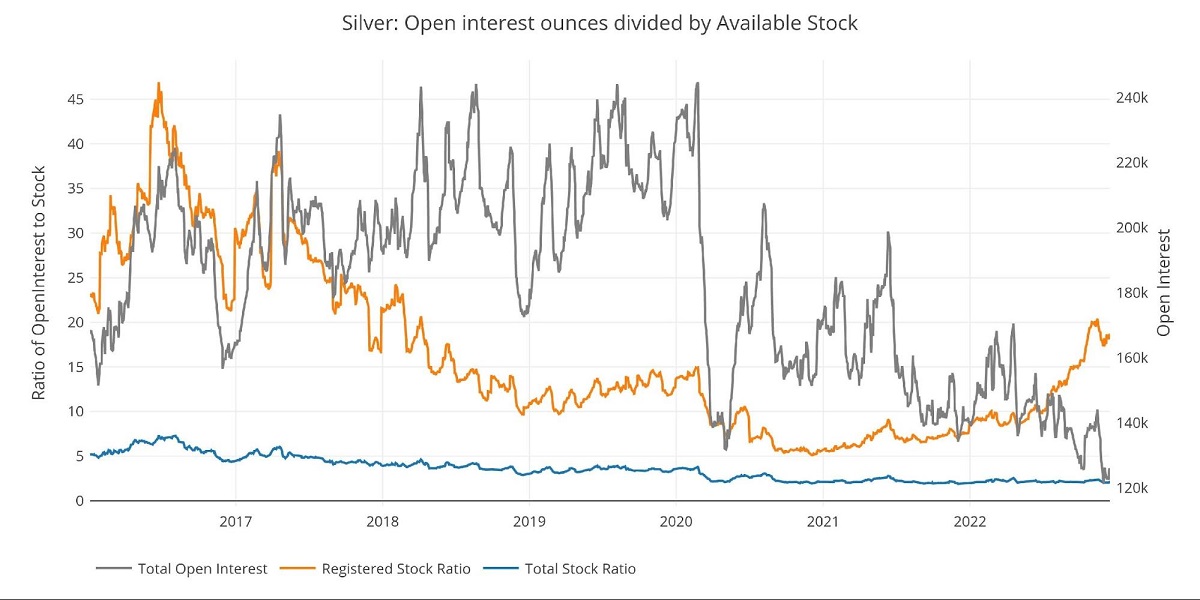
Figure: 15 Open Interest/Stock Ratio
Wrapping Up
The physical demand for gold and silver has continued unabated for months. This is the first month where the net flows have slowed, which is ironic given the historically strong delivery month of December.
Taking a pure data hat off and putting on a speculator hat… here is what I think:
Inventories are much thinner than the data shows. We have perhaps reached the bottom of metal available for delivery at current prices. This is why silver is seeing so many contracts remain unfulfilled AND why we have also seen a dip in net new contracts this late in the delivery window. There is simply no metal available so it is not being delivered.
Gold is a few months behind silver and is also a deeper market, but the same trends are starting to emerge.
This theory could be put to the test as soon as the end of December. Platinum is facing its major delivery month with very limited supplies available. If someone wanted to stress the Comex system, they could easily stand for delivery in amounts exceeding what’s available.
If I had to bet though, I don’t think the Comex will break on Platinum. What I will be watching is what tricks are used to satisfy demand. It can manifest itself in the data in multiple ways (e.g., cash settlements, a larger dive into close, etc.). Whatever happens, it will likely be a preview of what we can expect in silver and then gold in 2023 and 2024. Stay tuned!
Data Source: https://www.cmegroup.com/
Data Updated: Daily around 3 PM Eastern
Last Updated: Dec 16, 2022
Gold and Silver interactive charts and graphs can always be found on the Exploring Finance dashboard: https://exploringfinance.shinyapps.io/goldsilver/
*********
 Peter Schiff is the CEO and Chief Global Strategist of Euro Pacific Capital, best-selling author and host of syndicated Peter Schiff Show.
Subscribe to Euro Pacific's Weekly Digest: Receive all commentaries by Peter Schiff, John Browne, and other Euro Pacific commentators delivered to your inbox every Monday!
And be sure to order a copy of Peter Schiff's recently released NY Times Best Seller, The Real Crash: America's Coming Bankruptcy - How to Save Yourself and Your Country.
More from Silver Phoenix 500


