The Coming Trading Range Breakout


Although you wouldn’t know it by looking at the NASDAQ, this year has been a tough one for many investors. The relative lack of volatility, combined with the underperformance of small cap stocks, has kept many portfolios unchanged for the year to date.
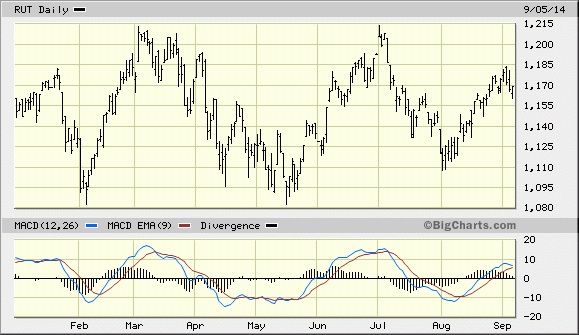
To give you an idea of what 2014 has been like for some investors, checkout the following graph of the Russell 2000 Small Cap Index (RUT). Clearly, the lateral trading range action of small cap stocks, which comprise a substantial portion of many portfolios, has been a frustrating experience.
It’s not just small cap investors that are feeling glum, however. Some of the leading blue chip retail and NASDAQ listed stocks have been stuck in a trading range for most of the year. In fact, some of the biggest retail and delivery service stocks have been range-bound for months. Retail and delivery are of course critical components of the U.S. economy; the relative lack of a defined trend in many of the leading retail stocks is an indicator of a lack of strong consumer spending.
The New Economy Index (NEI), which measures the health of the U.S. retail economy, is reflecting the lack of direction among the most important retail stocks as well as the lack of strong demand from consumers.
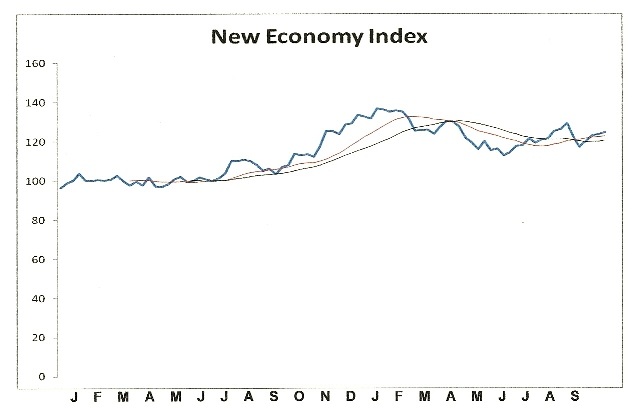
After reaching a peak at the start of 2014, the NEI turned down sharply and commenced a multi-month decline which anticipated the big drop in first quarter GDP. Since then the NEI has reversed its decline but has spent most of the summer stuck in a lateral range, as you can see here. The NEI is back above its key 12-week and 20-week moving averages but hasn’t yet broke out above its trading range ceiling. This implies that consumers are holding back on making large-scale purchases as they are uncertain over the durability of the recovery.
Three of the biggest components of the NEI are Amazon (AMZN), Ebay (EBAY), and Wal-Mart (WMT). Each of these three stocks has been stuck in a trading range for most of the year. In their own unique way, each company represents a huge segment of the U.S. economy. Amazon is the leading online retailer, Ebay is a leading marketplace for many independent business owners, and Wal-Mart is the nation’s largest employer. The stock price action of each is a reflection of the uncertainty of the U.S. consumer over the last several months. Much of this uncertainty originates from the withdrawal of central bank monetary stimulus this year.
Another reason for both investor and consumer uncertainty is apprehension over the strength of the recovery. After years of low employment, many Americans have finally found jobs but worry about keeping them. In short, the consumer confidence that characterizes a fully mature economic boom isn’t there yet. Until it returns consumers will continue to be cautious.
The fact that the 10-year cycle is bottoming this year has also contributed to the “go nowhere” nature of many segments of the market. Once the cycle has completely bottomed this fall, however, we should finally see the beginnings of a trading range breakout – a breakout that will be fully realized in 2015 once a new long-term cycle is underway.
********
Stock Market Cycles
Take a journey with me as we uncover the yearly Kress cycles – the keys to unlocking long-term stock price movement and economic performance. The book The Stock Market Cycles covers each one of the yearly cycles in the Kress Cycle series, starting with the 2-year cycle and ending with the 120-year Grand Super Cycle.
The book also covers the K Wave and the effects of long-term inflation/deflation that these cycles exert over stock prices and the economy. Each chapter contains illustrations that show exactly how the yearly cycles influenced stock market performance and explains where the peaks and troughs of each cycle are located and how the cycles can predict future market and economic performance. Also described in this original book is how the Kress Cycles influence popular culture and political trends, as well as why wars are started and when they can be expected based on the Kress Cycle time line.
Order today and receive an autographed copy along with a copy of the booklet, “The Best Long-Term Moving Averages.” Your order also includes a FREE 1-month trial subscription to the Momentum Strategies Report newsletter:
http://clifdroke.com/books/Stock_Market.html
Clif Droke is a recognized authority on Kress cycles and internal momentum, two valuable tools which have enabled him to call most major stock market turning points from 1997 through the present. He is the editor of the Momentum Strategies Report newsletter, published three times a week since 1997. He has also authored numerous top-selling books, including “The Stock Market Cycles.” For more information visit www.clifdroke.com


