Consolidation In Silver Price


-
Silver has gone to sleep after its recovery.
-
Silver is a highly speculative metal.
-
Sentiment will drive the price of silver.
-
The silver/gold ratio remains at a high level.
-
USLV and DSLV for short-term trading in the silver market.
Gold broke out to the upside in June when the price rose above the July 2016 high at $1377.50. Even though the yellow metal ran out of upside steam at the $1560 per ounce level, the price has not returned to the breakout level as of October 8. Meanwhile, silver has yet to challenge its July 2016 high at $21.095 per ounce, as it could only manage a rally to a high at $19.54 on the continuous futures contract.
Silver has approached the gold rally and technical break with caution. The most speculative of the precious metals moved appreciably higher than its late May and early June low at $14.245 per ounce. Since mid-August, the price has remained mostly above the $17 per ounce level. Silver made to above its 2019, 2018, and 2017 peaks during the most recent rally, but the 2016 high remained elusive.
Even the most aggressive bull markets experience corrective periods. In silver, the price has been consolidating, while daily and weekly price ranges have widened. The volatility in the silver market is not for the faint of heart. However, silver is a metal that offers nimble traders with their fingers on the pulse of markets plenty of opportunities when price variance increases.
The Velocity Shares 3X Long Silver ETN product (USLV) and its bearish counterpart (DSLV) are excellent short-term tools for those looking to participate in the silver market without venturing into the futures arena.
Silver has gone to sleep after its recovery
The price of silver found a bottom in late May and took off on the upside.
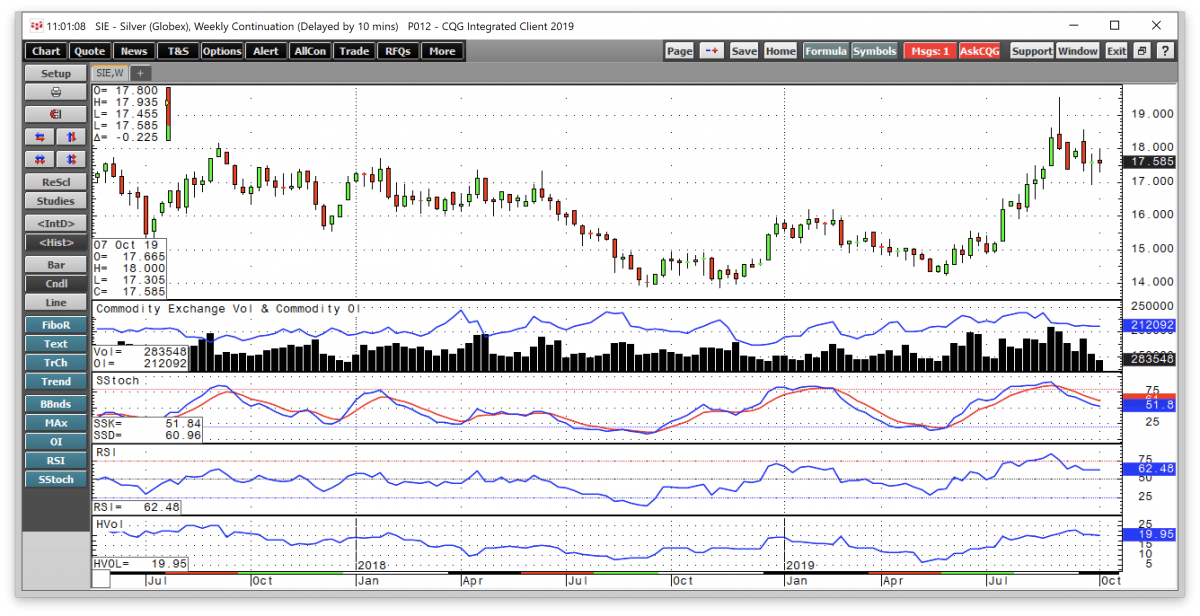
Source: CQG
As the weekly chart highlights, the price of silver found a bottom at $14.245 and moved to a high at $19.54 per ounce, a move of 37.2%. The move to the upside drove price momentum and relative strength indicators into overbought conditions. Since early September, the price of silver has corrected alongside gold. Silver fell to its most recent low at $16.94 on October 1, but the price has been consolidating between $17.24 and $17.86 since silver probed below the $17 level. Open interest has been flatlining between 210,000 and 218,000 contracts since early September. The total number of open long and short positions in the silver futures market has not moved all that much. At just under 20%, weekly historical price volatility is not at an elevated level. Since the high, the slow stochastic and relative strength index have moved towards neutral conditions.
Silver is a highly speculative metal
Silver tends to be the most speculative precious metal that trades on the futures exchange when the price gets going. The recent rally drove the price of gold 23.2% higher while silver's rally took it 37.2% to the upside over the same period.
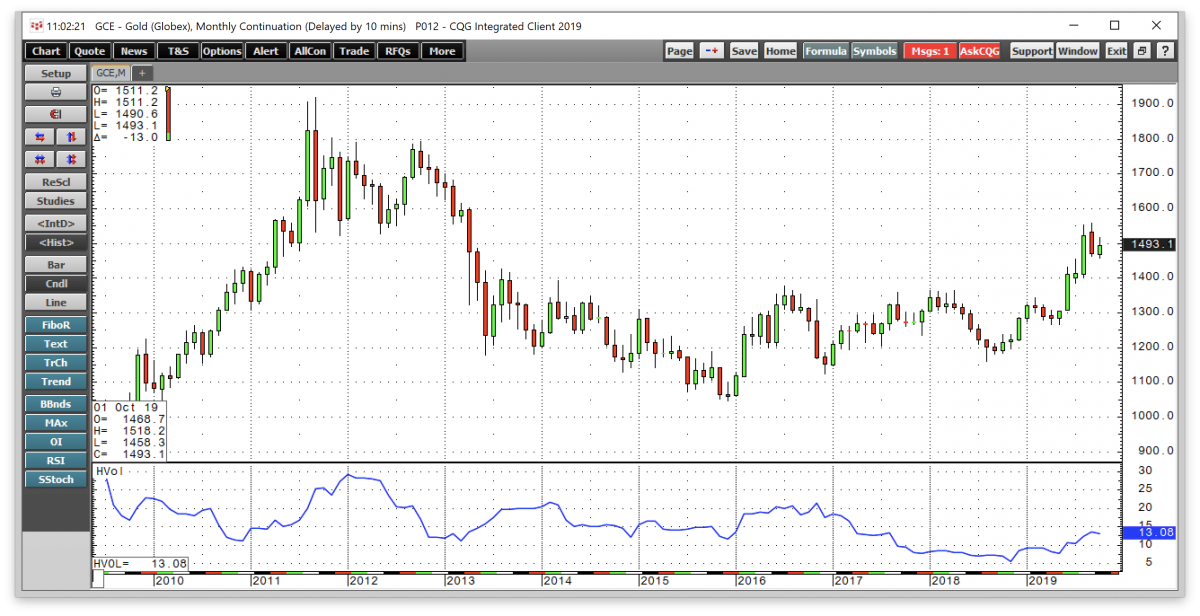
Source: CQG
The monthly gold chart shows that price volatility was around the 13.08% level as of October 10. The metric has ranged from 5.58% to 30.69% over the past decade.
Source: CQG
The monthly silver chart illustrates that the price variance metric was at 19.93% on October 10 and had ranged from 9.43% and 63.17% since 2019. Silver is a more volatile metal than gold over time.
Sentiment will drive the price of silver
Silver's penchant for price volatility is what drives speculators to the market. Over past decades, silver has a habit of outperforming the percentage price action in gold on the upside and underperforming on the downside. Price volatility is the mother's milk of opportunity for speculators who tend to flock to the silver market when the price begins to trend. Gold rose from a low of around $250 per ounce in the early 2000s to a high at $1920.70 in 2011 as the yellow metal moved around 7.68 times higher in price. Over the same period, silver moved from a low at $4.014 to a high at $49.82 in 2011, over 12.4 times higher.
Speculators love to hop onboard trends in the silver market. Sentiment is the primary driver of the price of the precious metal once it gets going.
The silver/gold ratio remains at a high level
Since the 1970s, the average level of the silver/gold ratio or the number of ounces of silver value in each ounce of gold value has been around 55:1.
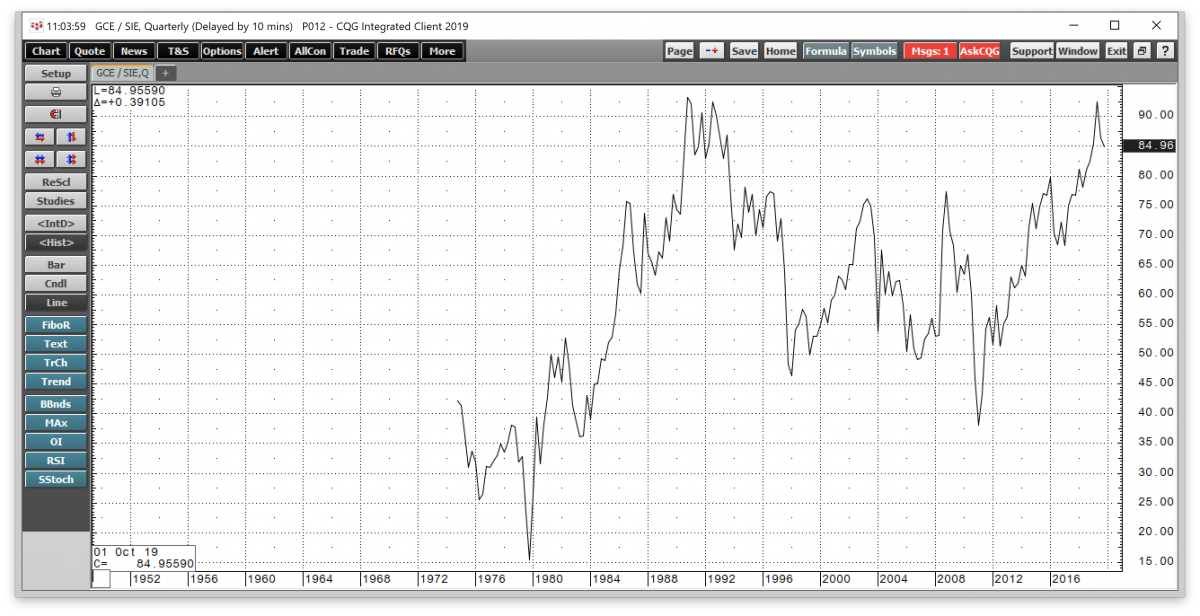
Source: CQG
The chart of the price of gold divided by the price of silver shows that the relationship has been between 15.47 and 93.18:1 on a quarterly basis. The short-term charts indicate a slightly wider range. The average is around the 55:1 level. At 84.96:1 on October 10, the ratio is above its average. In 2011, when gold and silver hit highs, the ratio dropped to a low at 38:1 on the quarterly chart.
The silver/gold ratio continues to tell us that silver is historically inexpensive compared to the price of gold. If gold's current price consolidation gives way to another leg to the upside, speculators will likely flock to the silver pushing the price higher. At $1500 per ounce in gold, a return to the long-term average in the price relationship between the two precious metals would put the price of silver at over $27 per ounce.
If the bull market in precious metals continues, silver has lots of upside potential.
USLV and DSLV for short-term trading in the silver market
The most direct route for a risk position in the silver market is via the futures and futures options that trade on the COMEX division of the CME. For those who do not venture into the world of the futures arena but wish to take a leveraged position in the silver market, there is an alternative. The Velocity Shares 3X Long Silver ETN product and its bearish counterpart DSLV do an excellent job of magnifying the price action in the silver market.
The fund summary for USLV states:
The investment seeks to replicate, net of expenses, three times the S&P GSCI Silver Index ER. The index comprises futures contracts on a single commodity. The fluctuations in the values of it are intended generally to correlate with changes in the price of silver in global markets.
Source: Yahoo Finance
USLV has net assets of $278.67 million, trades an average of over 546,000 shares each day, and charges an expense ratio of 1.65%. The price of nearby silver futures moved 37.2% from late May through early September.
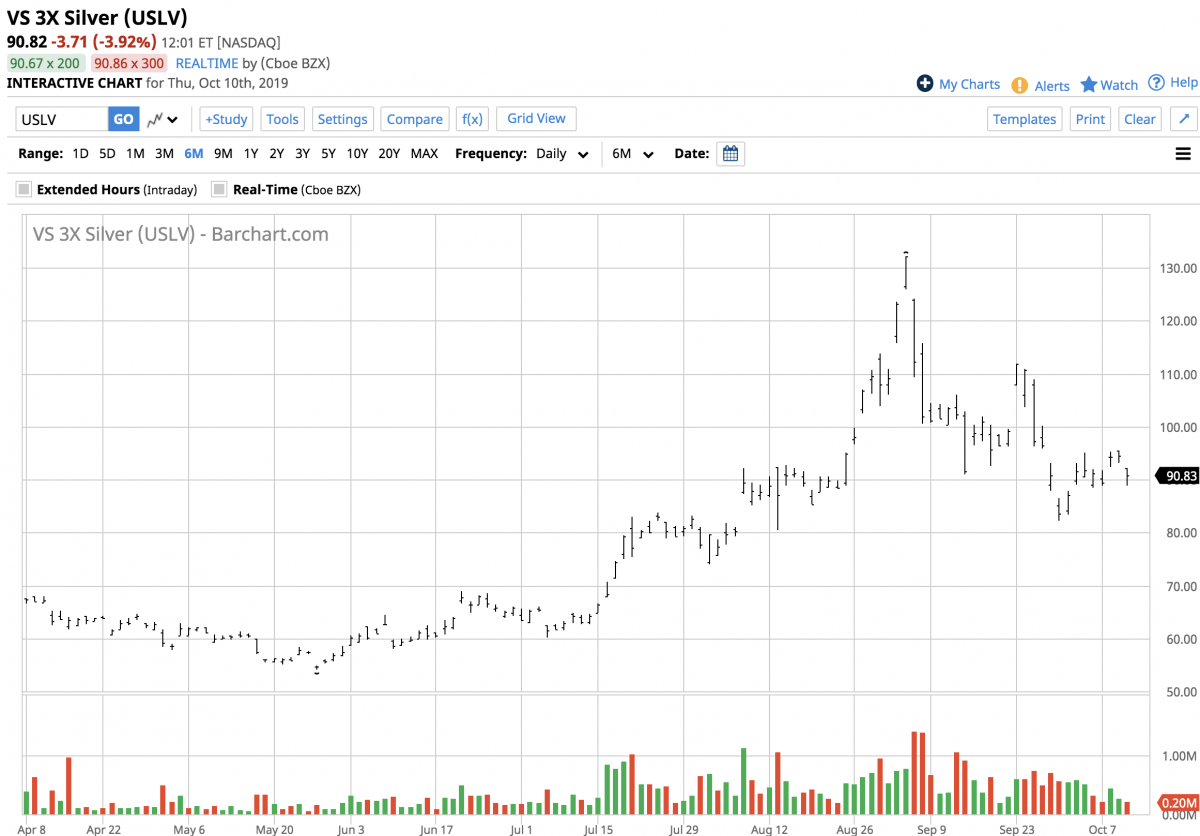
Source: Barchart
Over the same period, USLV moved from $54.09 to $132.23 per share or over 144%.
Meanwhile, the inverse product, DSLV, is a proxy for a short position in the silver futures market. DSLV has net assets of $33.85 million, trades an average of over 474,000 shares each day, and charges the same 1.65% expense ratio.
The price of nearby futures fell from $19.54 on in early September to its most recent low at $16.94, a decline of 13.3%.
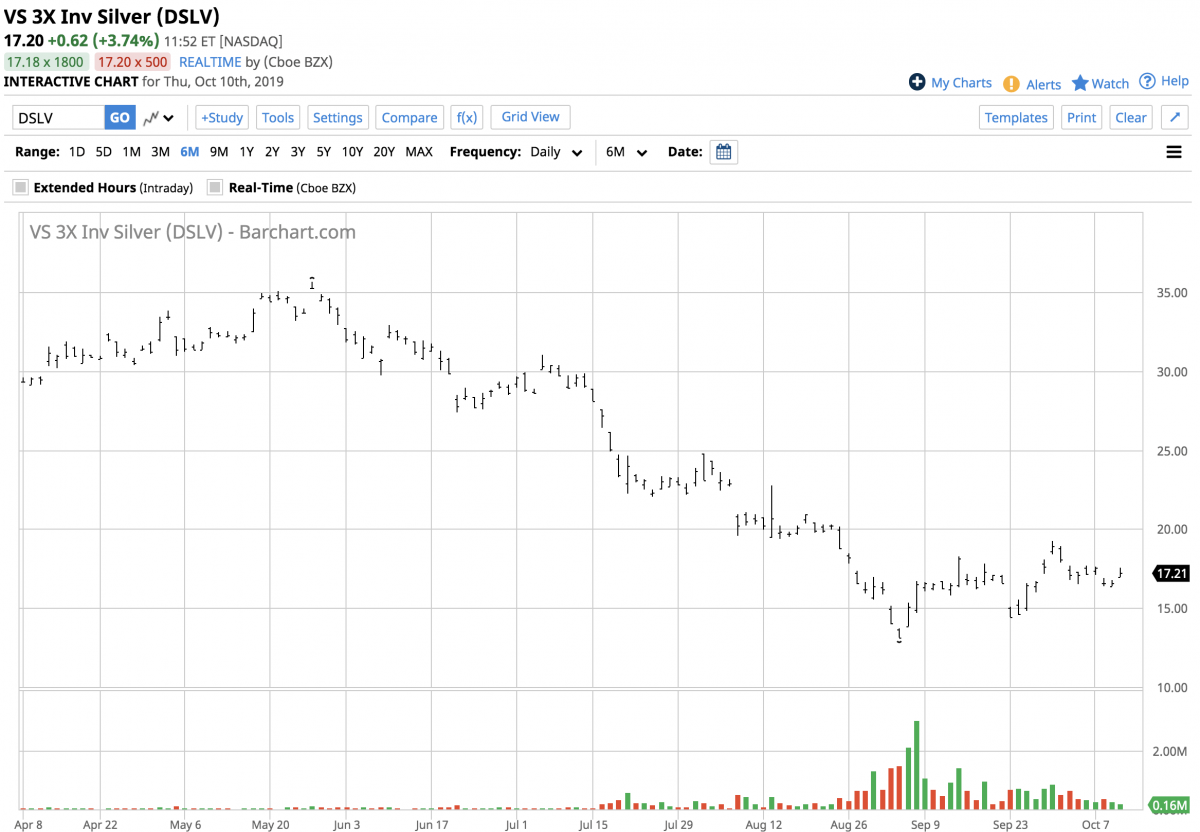
Source: Barchart
As silver dropped, DSLV rose from $13.10 to $19.21 per share or 46.6%. Both USLV and DSLV are only appropriate for short-term risk positions in the silver market. Leverage comes at a price, which is time decay in the case of these two ETN products. Timing is the most significant factor when it comes to trading with USLV and DSLV.
Silver is consolidating alongside gold as the price was above the $17.50 per ounce level on October 10. If the current period of consolidation gives way to another leg to the upside, we could see the silver market challenge the July 2016 at $21.095 per ounce. A technical break above silver's critical level of technical resistance could cause sentiment to become uber-bullish. Meanwhile, the leveraged ETN tools are not long or medium-term investment products but short-term instruments to catch a wave of buying or selling. Both time and price stops are the best way to approach USLV and DSLV as both are susceptible to periodic reverse splits that destroy their respective values.
The Hecht Commodity Report is one of the most comprehensive commodities reports available today from the #2 ranked author in both commodities and precious metals. My weekly report covers the market movements of 20 different commodities and provides bullish, bearish and neutral calls; directional trading recommendations, and actionable ideas for traders. I just reworked the report to make it very actionable!
Disclosure: I/we have no positions in any stocks mentioned, and no plans to initiate any positions within the next 72 hours. I wrote this article myself, and it expresses my own opinions. I am not receiving compensation for it (other than from Seeking Alpha). I have no business relationship with any company whose stock is mentioned in this article.
Additional disclosure: The author always has positions in commodities markets in futures, options, ETF/ETN products, and commodity equities. These long and short positions tend to change on an intraday basis.
The author is long silver.
*********
More from Silver Phoenix 500


