Consumer Discretionary Sector and Corporate Bonds On Verge of Sell-off


I have been warning of a peak in the markets and a continued capital shift in the global economy that continued to push the NASDAQ and DOW towards new all-time highs, while the foundations of the global markets continued to weaken.
I authored dozens of research posts regarding this phenomenon over the past 90+ days. Yet the clearest signs of this event may already be present in these Consumer Discretionary Sector and Corporate Bonds charts.
Consumers drive economic activity and corporate debt is often a measure of sustainable debt function within a functioning economy. When consumers tighten their belts and exit the economy in some form and Corporate debt is viewed as “more toxic” than “opportunistic” - something has changed in the global economy where a portion of the active consumer engagement of that economy is waning or has already left the building.
One of the biggest reasons economic contractions happen is because consumers exit the marketplace as a form of protectionism. Much like in 2008-09, when the credit crisis started hitting, many consumers were in shock and simply exited the marketplace completely. They didn't buy big-ticket items. They didn't go on trips. They didn't do much of anything other than try to pay their bills and to protect what they had. I call this the “toilet paper and toothpaste mode”. Consumers typically buy only what is needed at times like this and try to save as much as they can. You can get all of my trade ideas if you opt-in to my free trend signals alert list.
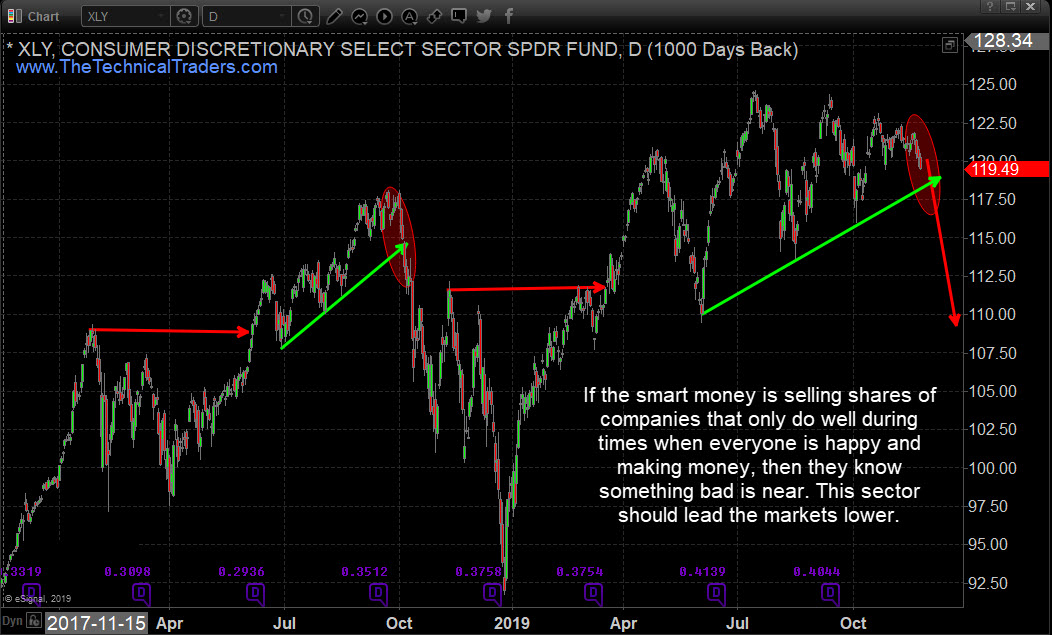
Consumer Discretionary Sector - Daily Chart
If the Consumer Discretionary sector breaks below the $118 level and continues lower, it would be a very clear sign that the lower price channel has been broken and that new downward pricing pressures are taking place in the global markets. The bigger picture is that a breakdown in consumer confidence could take place – much like a self-fulfilling event. When the consumer market begins to tighten, more fragile consumers (those without extra money to spend) begin to tighten their spending and begin to default on loans/credit cards.
As the event extends, more middle-ground consumers begin to change their tactics and risks become more evident to them. Each time a consumer sector moves into a protectionist mode, it pushes other areas of the economy into a crisis mode/contraction. Thus, the self-fulfilling process continues until a bottom is reached.
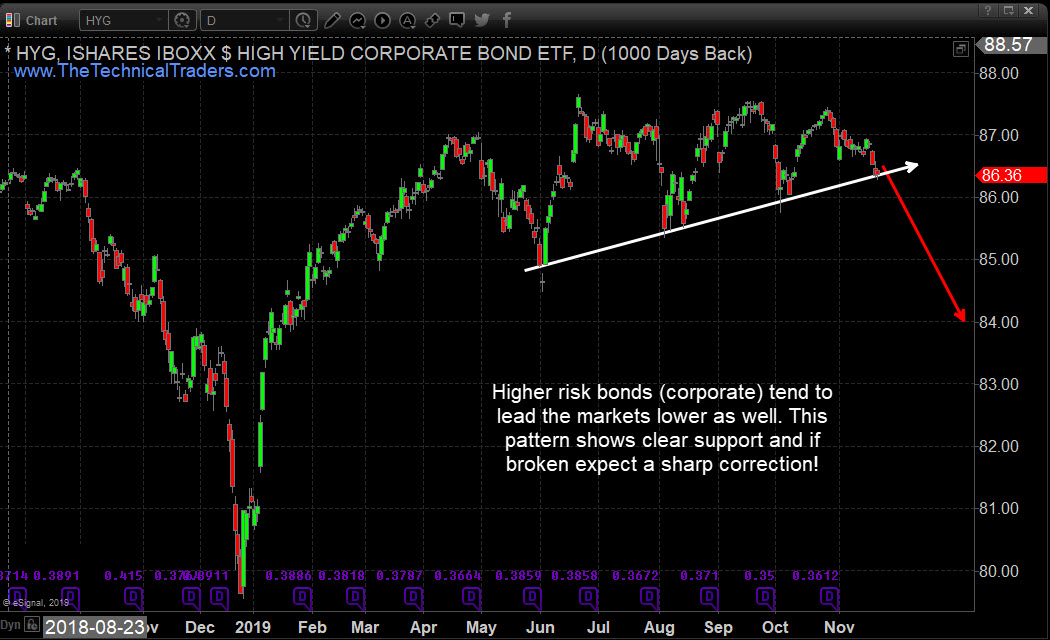
High Yield Corporate Bonds - Daily Chart
Corporate Bonds are another measure of economic engagement and debt function. A breakdown in Corporate Bonds would become a major debt risk factor for the consumer market and for the global stock market. As Corporate debt falls below the lower trend line level, consumers and lenders may begin to view Corporate Debt as more and riskier. This creates a type of panic is the consumer sector has already begun to move towards a protectionist mode.
Corporate Debt failures would represent a massive risk factor for the global economy because it would break the overall confidence within the markets and push consumers over the edge in terms of economic activity and engagement.
Remember near the end of 2018 when the market collapsed after the US fed raised rates in early October 2018. This type of breakdown was the same type of event. What changed was the US Fed had to alter its longer-term stance in the markets and decrease rates in order for the markets to feel more comfortable. Now, 12 months later, after the FED has lowered rates three times and softened forward expectations, what would a breakdown in consumer and corporate sectors really do to the markets? What would the Fed use to counter a price contraction and consumer panic?
Pay very close attention to both of these sectors going forward. We believe we are very close to the edge of a massive price breakdown event given our research. If these charts break lower and breakthrough price support, the global markets could contract by at much as 15 to 22% over time – possibly further.
I urge you visit my Wealth Building Newsletter and if you like what I offer, join me with the 1 or 2-year subscription to lock in the lowest rate possible and ride my coattails as I navigate these financial market and build wealth while others lose nearly everything they own during the next financial crisis. Join Now and Get a Free 1oz Silver Round or Gold Bar!
I can tell you that huge moves are about to start unfolding not only in metals, or stocks but globally and some of these supercycles are going to last years. This quick and simple to understand guide on trading with technical analysis will allow you to follow the markets closely and trade with it. Never be caught on the wrong side of the market again and suffer big losses. PDF guide: Technical Trading Mastery
As a technical analysis and trader since 1997, I have been through a few bull/bear market cycles. I believe I have a good pulse on the market and timing key turning points for both short-term swing trading and long-term investment capital. The opportunities are massive/life-changing if handled properly.
Chris Vermeulen
Technical Traders Ltd.
NOTICE: Our free research does not constitute a trade recommendation or solicitation for our readers to take any action regarding this research. It is provided for educational purposes only. Our research team produces these research articles to share information with our followers/readers in an effort to try to keep you well informed. Visit our web site (www.TheTechnicalTraders.com) to learn how to take advantage of our members-only research and trading signals.
*********

Chris Vermeulen has been involved in the markets since 1997 and is the founder of Technical Traders Ltd. He is an internationally recognized technical analyst, trader, and is the author of the book: 7 Steps to Win With Logic
Through years of research, trading and helping individual traders around the world. He learned that many traders have great trading ideas, but they lack one thing, they struggle to execute trades in a systematic way for consistent results. Chris helps educate traders with a three-hour video course that can change your trading results for the better.
His mission is to help his clients boost their trading performance while reducing market exposure and portfolio volatility.
He is a regular speaker on HoweStreet.com, and the FinancialSurvivorNetwork radio shows. Chris was also featured on the cover of AmalgaTrader Magazine, and contributes articles to several financial hubs like MoneyShow.com.


