Current Position Of The Market


SPX: Long-term trend – Bull Market
Intermediate trend – Is the 7-year cycle sketching an intermediate top?
Analysis of the short-term trend is done on a daily basis with the help of hourly charts. It is an important adjunct to the analysis of daily and weekly charts which discusses the course of longer market trends.
CHALLENGING IMPORTANT SUPPORT
Market Overview
It looks more and more as if the high point of 2093.55 which was reached by SPX on 12/29/14, is going to be an important high. Last week, the index closed at 1995, its lowest weekly low since 10/19. For the past month, the bears have been pounding away at a strong support level which stretches roughly between 1970 and 2020 and the bulls have been successful at repelling their attacks. But last week, with a close of 1995, this represents the bears’ most decisive penetration of that zone since the high was made, especially since the close represented both the weekly and daily low point. It would probably take a very bullish piece of news coming over the weekend to prevent SPX from following through on the downside next week.
With most indices experiencing relatively similar action – especially with leadership from XIV and XLF – the odds favor more weakness next week.
Momentum: The weekly MACD continued its fifth week of decline in positive territory, and the daily MACD continued on its downward course after being repelled by the zero line.
The weekly SRSI has now reached its extreme low reading with no sign of wanting to reverse. The daily is negative, in a downtrend, and looks ready to go lower.
Breadth: With a reading of -11.97, the McClellan Oscillator has just turned negative.
Structure: We may be on the edge of confirming the top of Primary wave III.
Accumulation/distribution: The short-term top is capable of generating counts which could challenge the low of the support area, while the longer term top is continuing to grow into a sizeable formation.
XIV: Closed on the low of the downtrend which started in June 2014.
Cycles: “The 7-year cycle appears to be slowly gaining a foothold”. The 10-wk cycle is due to make its low next week.
Chart Analysis
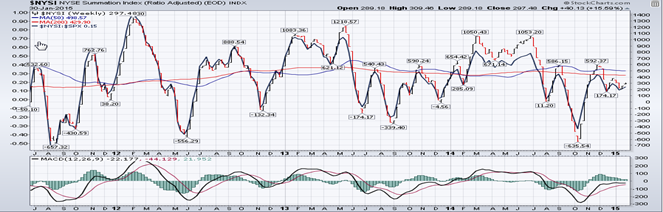
We start with the weekly SPX (chart courtesy of QCharts, including others below) with the McClellan Summation Index (courtesy of StockCharts.com) posted underneath it.
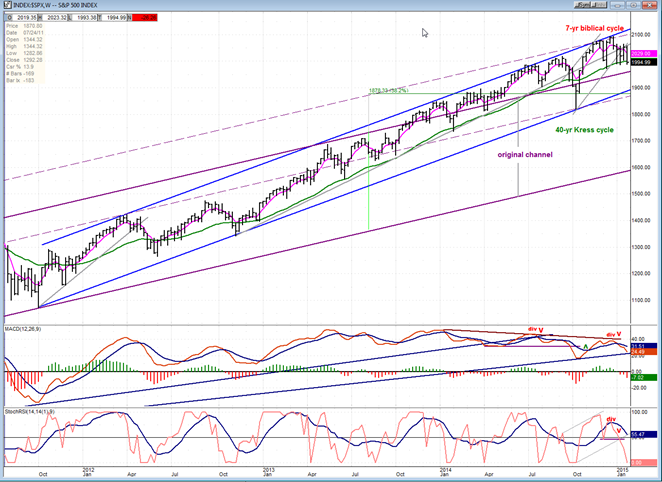
After rising above the top channel line of its long-term channel, SPX has only made a couple of brief forrays back into it since then. It continued to trade higher and higher outside of it until 12/29, when it reached its bull market high of 2093. Price deceleration at the top was minimal. Now, it seems intent on pulling back into the long-term channel. At only 40 points from it, it is even conceivable that it could do so next week, although it could also find support on the top channel line the first time that it retraces back to it. If the index succeeds in re-entering its major channel, the next level of support could be the bottom of its intermediate channel which is currently at (approximately) 1900. Before an intermediate downtrend is fully established, SPX would have to correct below the lower (blue) channel line of its intermediate uptrend channel.
Price momentum indicators are in a downtrend and suggest lower prices. Last week, SPX closed below its 30-wk MA (green) for the first time since October 2014, and for the second time since October 2012, but only by a small margin. Greater and longer penetration will have to take place to make this a valid trend shift of intermediate proportion. Also, more weakness will have to show in the McClellan Summation index, although it already appears to be in a long-term downtrend.
On the daily chart, I have drawn (purple) trend lines to outline the potential downtrend channel which is developing. Also, the green band represents the second layer of support that has stopped previous declines. The first layer has already been penetrated and the index is getting ready to challenge the second layer one more time.
The 120-DMA (purple) is roughly comparabe to the 30-wk MA and has provided strong support since November 2012. The green trend line which is the mid-channel line of the intermediate (blue) channel, and the red 200-DMA just below it have also served as support. If prices can close below all of these levels, the bears will have won a major battle if not the war in trying to establish an intermediate decline. If this takes place, you can see why the bottom channel line would arrest the decline, at least temporarily. It would have the assistance of the bottom of the purple channel line as well.
A key level to watch if prices go lower is the former low of 1972. 1973.81 is the level at which the 200-DMA closed on Friday. As you can see, we have a lot of markers that will define the state of the market immediately ahead and, if they are all penetrated, there cannot be any more arguments about who is taking charge of the market trend.
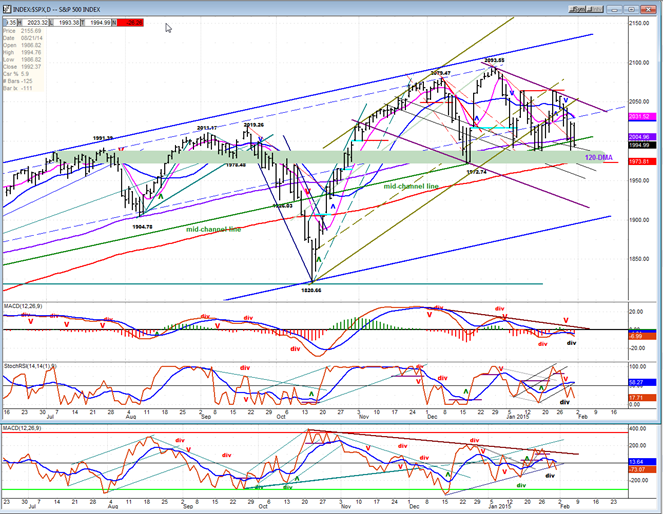
All the oscillators are in negative territory and declining, confirming that the short-term trend, at least, is in decline. The two lower oscillators have room to continue downward before they become oversold.
“The hourly chart holds the key to my expectation for lower prices next week. All three oscillators are now in a downtrend which looks like it is just starting.” That proved to be correct since prices continued down on Monday and declined for the whole week. On Thursday and during the early part of Friday, prices consolidated, but they closed on their low on Friday with the oscillators starting to turn down again. That makes for another potential decline next week, especially with the 10-wk cycle bottoming in the next few days.
The entire formation from the first low of 1972, while not perfect, has the appearance of a descending triangle, which is a bearish pattern consisting of lower highs combined with several bottoms at the same level. If this is correct, the bottom of the purple channel (better seen on the daily chart, above) would be a fair projection for prices to attain.
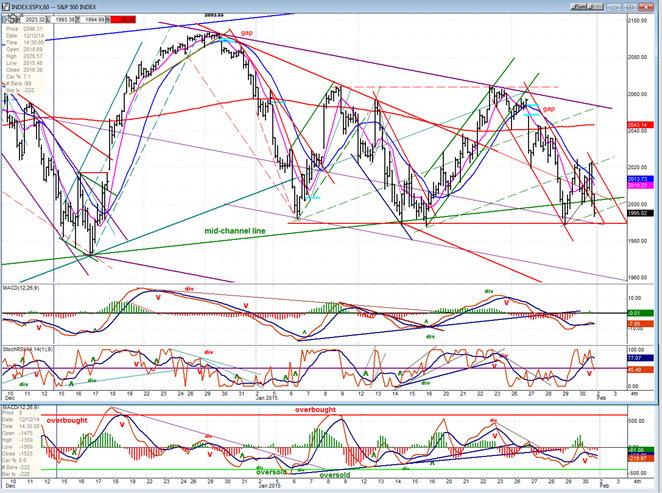
Since positive divergence could be developing in the price and A/D MACD, it is essential the we continue lower next week with these two indicators making new lows in order to see the downtrend continue.
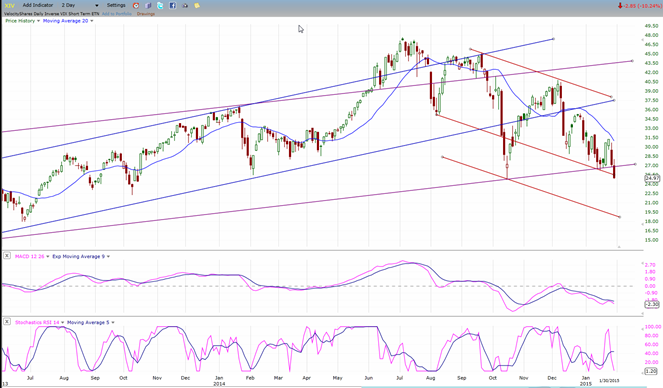
XIV (Inverse NYSE Volatility Index) - Leads and confirms market reversals.
On Friday, XIV not only made a new intermediate low for the decline which started in July, but it traded below its October low and outside of its long-term channel. There is nothing in any of these actions, separately or collectively, that bodes well for the market over the near term. This has also increased its relative weakness to SPX, manifold.
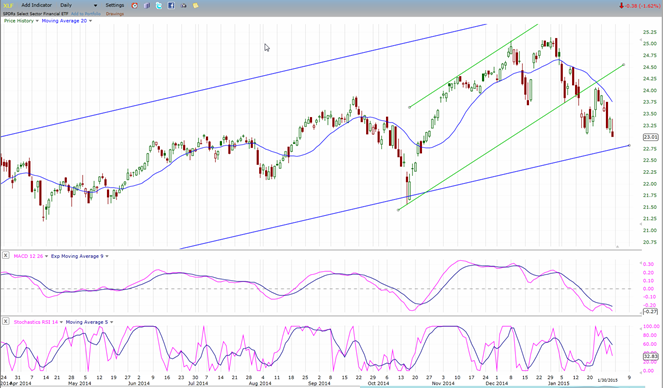
XLF (Financial Sector SPDR) - Historically a market leader.
Last Friday, XLF made a new low in its decline from 12/29, and it closed below its 200-DMA for the first time since the October low. Like XIV, this is a negative for the market but it could find temporary support on its intermediate trend line, slightly lower.
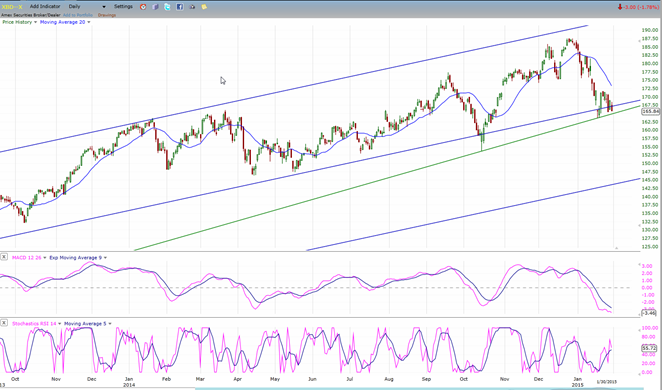
XBD (American securities Broker/Dealer)
XBD is intent on breaking below its 200-DMA! This is the fifth time that has challenged it in the past year. This time, however, looks a little more serious since its MACD is negative and has dropped below the October low. Its weekly chart looks even more negative with a decisive close below the 30-wk MA and a challenge to the trend line starting in October 2012.
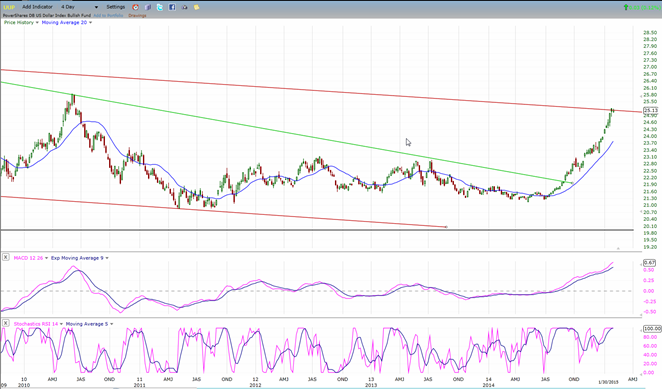
UUP (dollar ETF)
UUP exploded upward after moving out of a substantial 3-year base, rising without a meaningful consolidation to the top of its long-term consolidation channel. One would expect that this is where it should pause before moving higher to meet its base projection target.
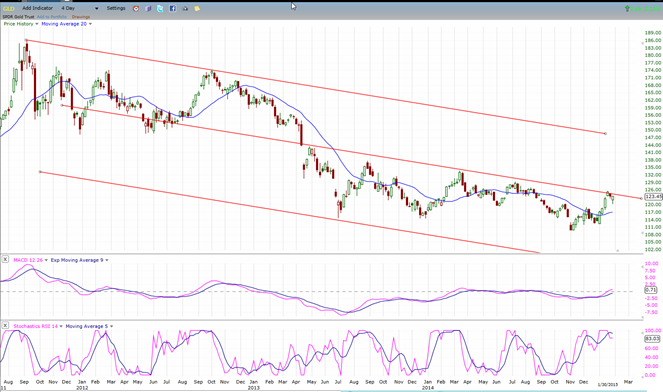
GLD (Gold trust)
GLD has rallied from its 25-wk cycle low to the middle of its long-term down channel where it is finding some expected resistance after filling a short-term count. Since the cycle is still in an up-phase and it does have a count which could take it a few points higher, it would be normal for it to advance further if it can overcome the resistance line.
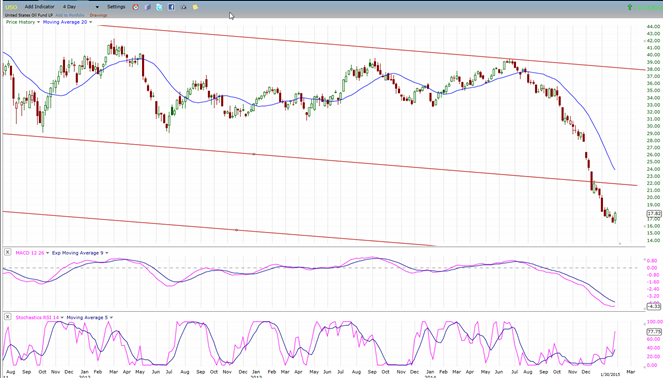
USO (US Oil Fund)
With WTIC having reached an initial downside target, it would be normal for it to pause in its long-term downtrrend and for USO to do the same. However, both indices would have to show a lot of willingness to reverse their trends before one could make a positive forecast about either. Since lower counts are available for both, a resumption of the decline should occur after adequate consolidation has taken place.
Summary
Last week’s continued weakness -- especially considering Friday’s close – added to the perception that SPX may be rolling over in preparation for an intermediate decline. Over the past few weeks, it has systematically eaten away at a substantial support zone and may be ready to finish the job this coming week. Its near-term path should tip the balance in favor of the stronger faction and pave the way for a potentially extensive follow-through.
Whatever takes place, it should only be viewed as a corrective phase of undetermined length within the bull market which started in 2009. Although if this turns out to be Primary wave IV for which the bottoming 7-year cycle is responsible, one should expect it to last for most of 2015.
********
FREE TRIAL SUBSCRIPTON
Market Turning Points is an uncommonly dependable, reasonably priced service providing intra-day market updates, a daily Market Summary, and detailed weekend reports. It is ideally suited to traders, but it can also be valuable to investors since highly accurate longer-term price projections are provided using Point & Figure analysis and Fibonacci projections. Reversal estimates are obtained from cycle analysis, an increasing use of EWT for structural analysis, and a thorough understanding of conventional technical analysis.
For a FREE 4-week trial, send an email to: info@marketurningpoints.com
For further subscription options, payment plans, weekly newsletters, and for general information, I encourage you to visit my website at www.marketurningpoints.com. By clicking on “Free Newsletter” you can get a preview of the latest newsletter which is normally posted on Sunday afternoon (unless it happens to be a 3-day weekend in which case it could be posted on Monday).
The above comments and those made in the daily updates and the Market Summary about the financial markets are based purely on what I consider to be sound technical analysis principles. They represent my own opinion and are not meant to be construed as trading or investment advice, but are offered as an analytical point of view which might be of interest to those who follow stock market cycles and technical analysis.

When Andre Gratian was a stock broker years ago, a friend introduced him to technical analysis of the market. Consequently, it is not an exaggeration to say that Andre fell in love with this approach! Ever since then, it has become an increasingly important part of his professional life. Gratian has studied the works of Wyckoff, Edwards & Magee, Edward J. Dewey (cycles) and many others. However, one of my most profitable undertaking has probably been to study Point & Figure charting, which he finds invaluable in analyzing stocks and indices. If he were restricted to one methodology, this is the one that he would choose. This well-rounded background has given him what he feels to be a special insight into the stock market, facilitating the recognition of meaningful patterns and the ‘turning points’ in all trends, whether they be short or long term. Andre feels very comfortable discussing the stock market and passing on meaningful information to others. His subscribers include individuals and money managers throughout the world. Moreover, his Newsletters are currently published on several financial sites, here and abroad.
More from Silver Phoenix 500


