Dow On The Cusp


The Dow is really testing the mettle of the bears. That includes me. As of today the rally has reached a height of 17124. Just shy of the all time high of 17151. So, is that the end of the rally? I wish I could say it was but there is still no sign of reversal. Let’s refresh ourselves of the big picture at this critical juncture.
MONTHLY CHART
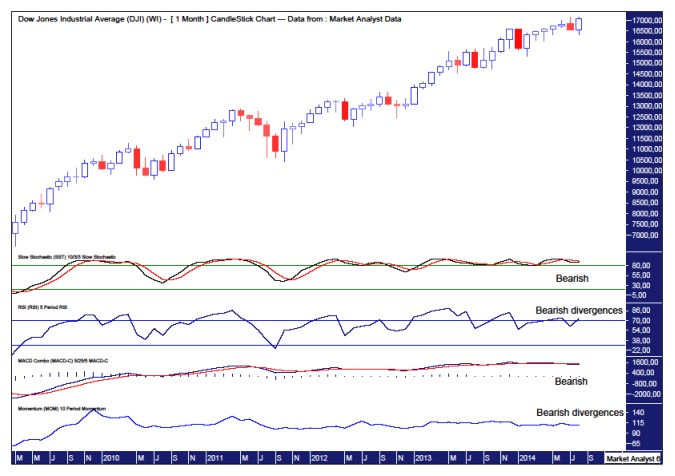
The point I wanted to make here was all the bearish indications being given from the long-term indicators. Let’s go through them from the top.
The Stochastic indicator confirmed a bearish crossover last month.
The Relative Strength Indicator (RSI) is showing a triple bearish divergence from the May 2013 high.
The Moving Average Convergence Divergence (MACD) also confirmed a bearish crossover last month.
The Momentum indictor is showing bearish divergences ever since the first high in 2009 after the major low. The market is running on fumes.
The Dow also had a virtually perfect cycle hit for top coming one day after the last major Bradley Model turn date on the 17th July. The cycle trend should now be down.
With all this evidence, I can’t help but think a big move down is nearly upon us. Even though price is testing its all time highs, I remain confident that the month of August will end in the red below 16561.
Now let’s go to the daily chart to see what exactly is going on.
DAILY CHART

The RSI is in overbought territory… but there is still room for price to go higher. If price were to make a new all-time high it may well be accompanied by a little bearish divergence.
The Stochastic indicator showed a bearish crossover last Friday, but this indicator can do some rolling about at extremes. A move higher would not surprise but bias has to be given to a move down shortly given its position.
The Parabolic Stop and Reverse (PSAR) indicator, denoted by the dots, is still bullish with price still not looking like threatening. So bias has to be given to higher prices here.
So where do things stand?
It has been my position that this is a bear market rally. However, even at these lofty heights, the pattern of trading is still yet to give any bearish indication. With that in mind, I cut my shorts at the close of trading today. Sometimes it is just better to let the market do its thing without trying to force the issue. So what is likely to happen?
From a price point, my opinion is that a move below today’s low of 17011 will be a sell signal. A move above today’s high will mean an all time high will be made. A marginal false break high, for mine.
Personally, one of my favourite topping patterns is what I refer to as a “pop and drop” top. Price pops to a new top before reversing and dropping hard. This topping pattern achieves two things.
Firstly, the pop up to new marginal high takes out stop loss orders in the process and makes the coast clear, so to speak. And it brings in the bulls who think the break is confirmation of the next leg up.
Secondly, the drop makes it hard for the bears to get set. The rallies are weak and the bears are forced to chase price down. Those that don’t will often get left behind.
It is this “pop and drop” top scenario I now favour to end the bull trend.
And what about your previous prediction of a bear market rally? Being successful in the market is not about who has the best technical analysis. It is about adapting to the markets signals despite what previous analysis may suggest. The market is dynamic. Last week’s technical analysis is not.
Just as I thought the rally would terminate around the 76.4% Fibonacci level, the pattern of trading around that level indicated there was further to go and so short positions were cut in response. And positions entered today were also exited today with no damage done. But remaining a bear, I continue to look for areas to enter into short positions. Perhaps the next opportunity will be tomorrow. And it is a big play opportunity that beckons in my opinion.
********
Please register your interest in my website coming soon. Any questions or suggestions, please contact austingalt@hotmail.com
© 2014 Copyright Austin Galt - All Rights Reserved
Disclaimer: The above is a matter of opinion provided for general information purposes only and is not intended as investment advice. Information and analysis above are derived from sources and utilising methods believed to be reliable, but we cannot accept responsibility for any losses you may incur as a result of this analysis. Individuals should consult with their personal financial advisors.
More from Silver Phoenix 500


